Download
1 / 41
460 likes | 673 Views
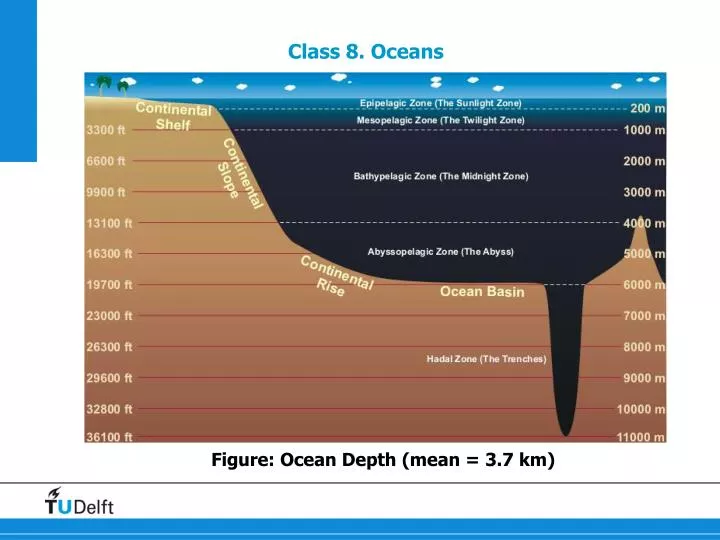
Class 8. Oceans. Figure: Ocean Depth (mean = 3.7 km). Ship-measurements. Only a limited area covered. SST from buoys. Ocean Surface Temperature from Remote Sensing (NOAA). cold water sinks. warm. - maximum insolation - albedo of water ~ 7%. cold water sinks. -2.0. 16.1.

E N D
Class 8. Oceans Figure: Ocean Depth (mean = 3.7 km)
Ship-measurements Only a limitedareacovered
Ocean Surface Temperature from Remote Sensing (NOAA) cold water sinks warm - maximum insolation - albedo of water ~ 7% cold water sinks -2.0 16.1 34.2 0C source NOAA http://www.osdpd.noaa.gov/ml/ocean/sst/sst_anim_full.html
Ocean Surface Salinity Prep>Evap Evap>Prep
ARGO: profiling the interior of the ocean (up to z=-2000 m) Data products: Temperature, salinity and density
Zonal average temperature in deep ocean warm salty stratified lens of fluid abyssz>1000 m homogeneousmass of verycold water
Schematic of vertical structure convection in the upper layercauses a verticallywell mixed layer strongverticaltemperaturegradientdefines the thermocline note: analogy to thermal inversion in the atmosphere verycold water present belowz<1000 m
Thermal expansion: Sea-level transgression scenarios for Bangladesh
Density (anomaly s), Temperature and Salinity higher density Fig. 9.2: Contours of seawaterdensityanomalies (s=r-rref in kg/m3) rref= 1000 kg/m3 PSU = Practical Salinity Unit ≈ g/kg grams of salt per kg of solution
Simplified equation of state (defined with respect to s0(T0,S0))
Simplified equation of state (defined with respect to s0(T0,S0)) a s s
Schematic of vertical structure tendencydue to radiativeheating T = temperature F = heat flux (Wm-2) rw = density of water cw = heat capacity of water μ
0 depth (m) upwelling cold water - deep convection cold water deep convection 1000 900S 00 900N latitude
0 P>E P<E P<E P>E depth (m) 1000 900S 00 900N latitude Low salinityifprecipitation (P) exceedsevaporation (E)
Which balances do apply in the ocean? Hydrostatic balance -> yes Geostrophic balance? Thermal "wind"? Ekman pumping/suction?
Rossby and Reynolds number in the ocean Farawayfrom the equator, e.g.latitude = 400, North-Southlengthscale L = 2000 km (east-westlarger) Velocityscale U = 0.1 m/s
Pressure in the ocean high pressure low pressure meandensity in water column
Which sea level tilt is needed to explain U=0.1 m/s? Example 1:assumedensity is constant
Geostrophic flow at depth Example 2: assumedensity is NOT constant, but varies in the x,y directions => r(x,y)=rref+s(x,y) 0 23 24 depth (m) 25 26.5 26 27 00 1000 900N 900S latitude
Estimating the geostrophic wind from the density field:The dynamic method Thismethodallowsforassessinggeostrophicvelocitiesrelative to somereference level Onecanassumethat at a "sufficiently" deepheightug=0
Geostrophic flow at depth z Example 3: I)assumedensity is NOT constant, but varies in the x,y directions => r(x,y)=rref+s(x,y) II) surface height is NOT constant
Geostrophic flow Example 1: In the oceangeostrophicflowapplies (nottoo close to equator) Pressureinducedbysurfaceheightvariationsη Example 2: Horizontal densitygradientscause a verticalchange in the geostrophicflowvelocity ("thermal" wind) Example 3: In principlebothheight and densityvariationsmayapply
0 depth (m) upwelling cold water - deep convection cold water deep convection 1000 900S 00 900N latitude
Wind-driven ocean flow Equationswithwind-stress
Wind-driven ocean flow Equationswithwind-stress Split velocity in geostrophic ('g') and ageostrophicparts ('ag') e.g.
Ekman pumping (downwards)/suction X wind into the screen
Ekman pumping (downwards)/suction elevated sea level height in convergence area midlatitudes tropics
Ekman pumping/suctionExplanation mass conservation 0
Ekman pumping/suctionExplanation 1. we do not assume that f is constant, but f=f(y) 2. variations in wind stress are much larger than in f
Ekman pumping/suctionExample = 32 m/year
Ekman pumping/suction from wind stress climatology f=0 downward upward