Download

1 / 16
160 likes | 311 Views
Using scanner technology to collect expenditure data. Andrew Leicester and Zoë Oldfield. Outline. Consumer panel expenditure data What is it? How is it collected? Key objectives of our research Main findings Comparisons with other surveys Survey fatigue Attrition

E N D
Using scanner technology to collect expenditure data Andrew Leicester and Zoë Oldfield
Outline • Consumer panel expenditure data • What is it? How is it collected? • Key objectives of our research • Main findings • Comparisons with other surveys • Survey fatigue • Attrition • Use of the data for social science research
Consumer scanner data • Market research organisation Kantar, Worldpanel data • Representative GB panel of 15,000 – 25,000 active households • Ongoing recruitment sampling approach • Data on food & grocery purchases, Nov 2001–Nov 2007 • Collected by in-home barcode scanner recording product details • Includes off-sales alcohol, some non-food, no tobacco or baby food • Purchases from all stores, including most non-barcoded items • Prices collected via till receipts sent to Kantar (including special offers) • Demographic data • June 2006: • 2.32m recorded purchases (85% food, 13% non-food, 2% alcohol) • £3.39m total expenditure (76% food, 16% non-food, 8% alcohol) • 18,835 households, 3,485 stores, 84,481 individual products
Aims and objectives • Scanner technology offers considerable potential advantages • Panel data, extreme disaggregation, price and quantity data • Questions over data quality / effect of scanner technology • Key aims: • Assess the strengths and weaknesses of scanner data • Comparison to existing, well-understood data sources (EFS, BHPS) • How far are differences driven by collection method? • Recruitment and retention (attrition) • Expenditures: accuracy of records, changes over time (fatigue) • Inform future research using scanner data • Make recommendations for data users • Raise awareness of data amongst research community
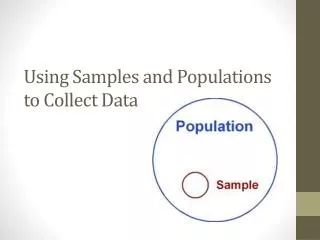
Samplingissues • Worldpanel is a non-probability sample • Inference techniques are invalid • Should we be using this data at all? • Very rich data • Very costly to collect from scratch • This project should provide the starting point to evaluate whether it is feasible to use scanner technology to collect expenditure data in other surveys
Demographic comparisons: cross section (2006) • Kantar deliberately over-sample multi-person households • EFS 32.5% single adult households, Worldpanel 22.5% • Fewer very young and very old households in scanner data • EFS 8.1% of households contain someone 80+, 3.8% in Worldpanel • Incomes substantially lower in Worldpanel than EFS • EFS 13.2% have gross annual incomes above £60,000, Worldpanel 5.3% • We calculate our own weights using propensity score methodology
Demographic transitions • Household data collected at signup via telephone interview • In principle, updated every 9 months or so • Proper updating would allow analysis of expenditure response to demographic shocks (retirement, children, unemployment) • Evidence that Worldpanel records transitions poorly • Compare transitions in Worldpanel and British Household Panel Study
Expenditure comparisons (2005) • Mean weekly total food & alcohol scanner data spending level 80% of EFS level • Modal spend similar, around £25 - £30 / week • Worldpanel appears to record fewer high-spending households • Not accounted for by demographic differences between surveys • Propensity weights reduce Worldpanel spending to 75% of EFS levels • But patterns of spending (budget shares) similar across surveys • ‘Under-recording’ similar across broad spending groups
Expenditure comparisons (2005) • Mean weekly total food & alcohol spending level in Worldpanel is 80% of EFS level • Modal spend similar, around £25 - £30 / week • Worldpanel appears to record fewer high-spending households • Not accounted for by demographic differences between surveys • Propensity weights reduce Worldpanel spending to 75% of EFS levels • But patterns of spending (budget shares) similar across surveys • ‘Under-recording’ similar across broad spending groups • Though relatively low alcohol spend in Worldpanel • More detailed comparison: low spend on top-up items, non-barcoded items • Variation in shortfall across demographic groups • Relatively higher spending for younger, single, childless households • Also for poorer, inactive/unemployed • Effects of time on ability to record?
Fatigue: changing spending within household • Households tire of participating, stop reporting all spending • Problem potentially worse for some goods, trips, households • Evidence of strong decline in recorded spending even in two week, one-off survey • Ahmed et al, 2006: Canadian Food Expenditure diary (FoodEx) • Spending 9% lower in week 2 than week 1 • Better or worse in consumer scanner data? • Participation potentially indefinite • Easier to scan barcodes than to keep a written diary • Use household fixed-effects model to estimate within-household spending changes relative to first full week of participation
Fatigue results • Spending around 5% lower on average after 6 months • Variation across goods and households • Households with children: higher early fatigue • Childless households: no early fatigue, then more sustained decline • Pensioner households: no evidence of fatigue • Greater for alcohol, sweets & chocolates, smaller for fish, fruit • Patterns consistent with Canadian diary evidence • Does not explain spending gap with EFS • Spending gap 25% for full sample, 16% for ‘unfatigued’ new starters • Ultimate outcome of fatigue may be attrition from survey
Attrition • Sample of households that we observe begin participating • Estimate non-parametric survival function: • 7% drop out within 4 weeks • 39% drop out within 1 year • 54% drop out within 2 years • 18% survive for 5 years or more • Average duration is 48 weeks where we observe both start and end
Attrition • Worldpanel: probability of new household being observed 1 year later 63% • BHPS: 86% of wave 1 sample gave full interview in wave 2 • Hard to make direct comparison but Worldpanel attrition rate not bad … • Worldpanel attrition varies with observable household characteristics • Results of semiparametric duration model show: Significantly higher risk of attrition Households aged under 30 Households with any children Lone parents Household without a car Significantly lower risk of attrition Households aged over 30 Single adult households Childless households Having new scanner technology
Conclusions • Scanner data offers considerable advantages for research • Need to be aware of the potential biases and problems that arise • Understanding the implications of data collection method vital • Sample composition differences at least partly driven by known reporting issues (e.g. multiple adult households) • Demographics and fatigue do not explain expenditure differences • On average, attrition and fatigue not major problems • Top-up shopping, time to scan have effects on spending • Data collected for market research, not social science research • Non-probability sample • Transitions poorly recorded, limits value of panel aspect • But also some advantages; non-traditional data that is very rich and not currently available elsewhere