Download
1 / 28
280 likes | 381 Views
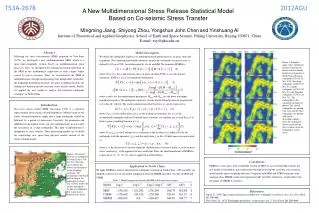
New Multiple Dimension Stress Release Statistic Model based on co-seismic stress triggering. Mingming Jiang Shiyong Zhou ITAG, Peking University Email:jiangmm@pku.edu.cn. Outlines.

E N D
New Multiple Dimension Stress Release Statistic Model based on co-seismic stress triggering Mingming Jiang Shiyong Zhou ITAG, Peking University Email:jiangmm@pku.edu.cn
Outlines • Physical interpretation for the risk function in the stress release model • Upgrading the stress release model with the co-seismic stress triggering model • Application to the historic catalogue of North China and results
Stress release model • Coupled stress release model Is it the real situation that the stress will all release in the whole region after one earthquake? depends on mechanisms
Review the stress release model in the physics view What is the nature of the risk function of the stress release model? How can the stress variation correlated to earthquakes be modeled correctly ?
Evidence from the laboratory • In static fatigue studies, the data are generally reported as the mean fracture time <t> (Scholz, 1968) • The risk function of stress release model real stress Num. of the events per time unit
Conclusions 1 • The risk function could be an expression of the static fatigue in the crust • The stress level X in the risk function could be the real stress
Upgrading SRM with the co-seismic stress triggering model the induced shear stress on the fault plane due to earthquakes
How to get ? • The procedure of Okada (1992, based onstatic displacement field of the elastic medium triggered by a slip) was used to get induced shear stress
How to get the loading term N ρ(x,y) azimuth=16.5°
Historic catalogue from 1300 to 1997 in North China Ms≥6.0 64 events Ms≥6.5 37 events
Results more than the classic stress release model We can get the spatial distribution of the conditional intensity at any time
an example High risk is reasonable here?
The weighted conditional intensity • A try, we took the kernel estimation of spatial distribution of seismicity as the spatial weight function. (stock and smith, 2002)
Data:Ms≥4.0 1970-2005 too high due to the aftershocks of Tangshan Eq. ??
at t=1997 Might be higher due to weight function We are still seeking for a reasonable spatial weight function Reasonable now
Distribution ofat the times before and after M8.0 earthquake of Sanhe of Beijing in 15th century before after
Distribution of at the times before and after Tangshan M7.8 earthquake in 1976 before after
Conclusions 2 • The multiple dimension stress release model could be got based the multiple dimension physical model instead of the simple physical model. • The spatial distribution of the conditional intensity could be very useful in the hazard analysis, if it could be express in a proper way. • Fitting data better than the classic SRM (lower AIC) • The additional sorts of data are needed besides the traditional catalogues. These data can be easily got in modern catalogues, but the problem is the modern catalogues are not long enough.
depth (feng, 1981) strike and dip angle (Shen, 2004) Ms≥6.5:data from geologic and seismic survey Ms≤6.5: the same as the nearest event whose strike and dip is known Data processing sediment 4.2km depth 40.3km moho
Data processing • Slip angle the same as the slip angle of the outside loading • Rupture length and width, displacement the empirical relationships between magnitude and them. (Donald et al, 1994)