Download
1 / 40
400 likes | 481 Views
March 29, 2008 Wharton School. The Inter-Regional Migration in China Shuming Bao China Data Center the University of Michigan. Questions. W ho are moving? W hy moving? W here from and where going? W hat impacts? W hat driving factors? W hat is past, current and future trends?

E N D
March 29, 2008 Wharton School The Inter-Regional Migration in ChinaShuming BaoChina Data Centerthe University of Michigan
Questions • Who are moving? • Why moving? • Where from and where going? • What impacts? • What driving factors? • What is past, current and future trends? • What data sources?
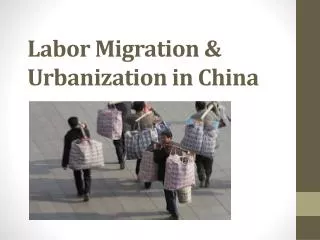
Background • Changes in spatial distribution of population: • 1949-1982, primarily dominated by high natural population growth and controlled by the government • 1982-2000, featured by the increasing migration with a declining natural population growth • Shock effect: • Rapid regional development in coast area under marketing economy since 1980 => unbalance labor market • Deregulated household registration since 1990 => greatly enhanced labor mobility • Rapid Urbanization: • Remarkable growth in urban cities and rural towns in China from 1980’s-2000’s. • There were about 41,636 townships (6,152 Jiedao, 19,522 Towns and 21,499 Xiangs) in 2005, with a urban town population of 562 million and a Xiang and rural township population of 745 million.
Who They Are? • Rural labor released from agricultural work • People looking for a job change or relocation • Students • People moving to new houses • Family union • Retired people for new permanent places
Who They Are: Educational Attainment • The migration with middle school and under count more than 60% • The majority of inter-province migration have a lower education than intra-province migration
Who They Are: Occupation • The migration in production and agriculture count about 56% • More than 60% of inter-province migration are in production industry
Why They Move? • Looking for new jobs • Job transfer of relocation • Study or training • New houses • Move with family
Where to Go?Destination by City, Town and Rural The cities and towns attracted more than 80% of migration.
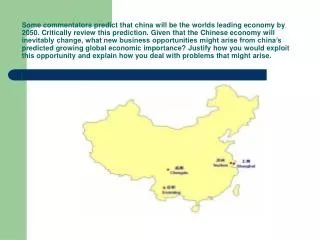
Where to Go: Centers of Attractions Robert Bachi’s Preference Index: Data Source: China 2000 Population Census 1. Beijing 2. Shanghai 3. Guangdong 4. Xinjiang
Spatial Distributions of Intra-Province Migration Data Source: China 2000 Population Census
The Driving Factors for Migration: An Extended Model Dependent variable = Inter-provincial migration rate (the migration from province i to province j divided by total migration from province i) Independent variables Distance between province i and j Ratio of destination to origin income Stock of previous migrants in destination Education level in origin Education level in destination Ratio of urban population share Ratio of destination to origin mean temperature Ratio of destination to origin per capita real FDI Ratio of destination to origin per capita real fixed asset investment Ratio of destination to origin manufacturing share Ratio of destination to origin share of population that is minority The impact of East and West development
Some Findings on the Major Influences on Inter-regional Migration • Past migration flows • Distance • Unemployment rate in origin • Spatial differences in urbanization • Spatial differences in climate • Spatial differences in construction spending and FDI • Where destination is located (East and West)
What Impacts on Labor, Economy and Social System Structure • Impact on population and labor force structure • The increasing dependency ratio in rural areas and the Western China regions • Impact on urban-rural structure • The increasing urban population density • Redistribution of urban-rural population • Segregation • Impact on social system structure and public policies • Household registration • Education • Medical care system • Retirement system • Employment/Unemployment system
The Trends of Migration in China (1980-2005) • There are about 189 million people moved in recent years, the intra-province migration counts about 66% while the inter-province migration counts 34%. • The inter-province migration keep increasing since 1980s
89.6% City 35.1% 29.89% 3.8% 6.6% 32.1% Town Rural 32.8% 39.3% 39.3% Changes in Urban-Rural Migrationthe migration flow between cities, towns and rural region • Increasing: % of migration out from cities from 17.9% in 82-87, 18.6% in 85-90, 30.9% in 90-95, and 31.4% in 95-00 • Declining: % of migration out from rural areas from 68% in 82-87 to 58.7% in 95-00
Changes in Inter-province Migration (85-90, 90-95, 95-00, 00-05) • Increasing inter-province migration flows from 85 to 2005 • Stronger tendency of local concentration • Big loser of migration: the central region
Challenges and Opportunities • There are still a large pool of rural labor force to be relocated (By the year of 2005, the rural population is about 800 million, accounting about 57% of national population. It is estimated that about 200 million rural labor force will be looking for jobs within next several years) • Restructuring in developed regions and relocated jobs • The increasing dependency ratio in rural and western regions • Discrimination toward the migration without local household registration (education, job opportunities, medical and retirement benefits) • Preservation of culture diversity • Pressure on environment and increasing demand for resources
Data Sources for Migration Studies • Government Statistics • Survey Data (rural, urban, enterprise, market) • Census Data (population, basic units, agriculture) • GIS Data (administrative boundaries, roads, rivers, land, elevation,….) • Remote Sensing Data
China Census Data with GIS Maps - The 2000 China Township Population Census Data with GIS Maps - The 2000 China County Population Census Data with GIS maps - The 2000 China Province Population Census Data with GIS Maps - The China Historical Population Census Data with GIS Maps (1953, 1964, 1982, 1990, 2000) - China 2000 Population Data with One sq km GIS Maps - China 2004 Economic Census Data with ZIP Maps
What is Available in the Census Data > 2,000 demographic variables in 2000 population Census data> more than 5 millions units in 2004 economic Census data Geographical Levels: Country | Province | Prefecture | County | Township | 1 sq km Grid 2004 Economic Census: • Employment • Revenue • Industries • Products • Ownerships 2000 Population Census: • General Information • Nationalities • Age Structure • Household Structure • Education • Fertility • Deaths • Marriage • Migration • Housing Status • Industries and Occupations
2000 Population Census of China • Date and Time: 0:00AM of November 1, 2000 • Residents: All permanent residents who have Chinese citizenships and have permanent living places in Mainland China. • 2000 Census forms: • Short Form • Long Form • Death Form (dead between 11/1/1999and 10/31/2000) • Temporary Resident Form (live in the place and left the original pace with household registration for less than 6 months)
Migration Data in 2000 Census • Those who have a different counties or districts of birth (within or outside of the current province) than the current counties or districts • Those who have moved from other townships to the current place within last 5 years (95, 96, 97, 98, 99, 00) • Those who have moved from other places to current place for more than five years • Those who don’t have the local household registration but have been living in this townships for more than 6 months • Those residents who have local household registration but have left for other places for more than 6 months • Those who have resided in this township for less than 6 months but have been away from the place of their permanent household registration for more than 6 months. • Those who live in this township during the population census while the places of their household registration have not yet settled. • Those who used to live in this township but are working or studying abroad during the Census and have no permanent household registration for the time being. • Where the residents were from: Jiedao, town or townships of the same or other provinces • Migration by age sex, and reasons for moving from other places to the current place • The Intra or Inter-province Migration by education (No Schooling, Eliminate Illiteracy, Primary School, Junior Middle School, Senior Middle School, Specialized secondary school, Junior College, University, Graduate Student) • The Intra or Inter-province Migration by occupation • The intra or inter-province female migration with birth orders of 1st, 2nd and 3+ between November 1st of 1999 11.l and October 31 of 2000.
2000 Census Data Tables The 2000 Census data table consists of two parts: The first part (A tables) contains data from all households that reflects the basic situation of population. The second part (L tables) contains data from the long forms which present various detailed compositions of the population. • Short Form : basic information • General Information • Nationalities • Age • Education • Households • Deaths • Migration • Housing • Long Form (9.5%, households selected by a random sampling program): extended information, including all short form items plus other items • General Information • Nationalities • Education • Industries and Occupations • Marriage • Fertility • Migration • Housing
Some Notes on 2000 Census • Data in the publication do not include population not enumerated in the Census. • Data in the publication do not include the 2.5 million servicemen of the People's Liberation Army. • Total population as shown in this publication is 1,242.61 million, or 23.22 million less than the population figure of 1,265.83 million (including 2.5 million servicemen) released by the National Bureau of Statistics. • The post-Census sample survey indicates an undercount of 1.81% in the 2000 Census. • The sampling ratio for various compositions of the population may not be the same as household is used as the ultimate sampling unit.
Historical Population Census Data with Maps(1953,1962,1982,1990,2000) Census 1953 Census 1962 Census 1982 Census 1990 Census 2000
China Population Grid Maps (one km2) Population Density Elevation Migration (%) Labor Force (16-64) Sex Ratio (M/F) Aged Population(64+)
China Data Online • CHINA STATISTICS • Monthly Statistics • National Statistics • Provincial Statistics • City Statistics • County Statistics • Industrial Data • Statistics on Map • Statistical Yearbooks • CENSUS DATA • Economic Census Data • Industrial Census Data • Population Census (82,90,00,05)
References • Shi, Anqing, Shuming Bao, 2007. Migration, Education and Rural Development: Evidence from China 2000 Population Census Data. In Journal of Chinese Economic and Business Studies. 2007, Vol. 5 (2): 163 – 177. • Bao, Shuming, Shuanglin Lin, Changwen Zhao (Eds), 2006. China’s Economy After WTO Accession, Ashegate. • Zhao, Changwen, Wing Thye Woo, Shuming Bao (Eds.), 2006. Sustainable Development and Global Challenges: Towards a New Paradigm for Developing Western China. Sichuan Publishing Co. • Wu, Haiying, Qinling Duan, Shuming Bao (Eds.). 2006. The Sustainable Development of Regional Economy in the West China. China Economic Press. • Bao, Shuming, Anqing Shi, and Jack W. Hou. 2006. Migration and Regional Development in China. In Shuming Bao, Shuanglin Lin, Changwen Zhao (Eds.), Chinese Economy after WTO Accession. Ashegate. • Bao, Shuming, Anqing Shi and Jack W. Hou. 2005. An Analysis of the Spatial Changing Patterns of Migration in China. In China Population Science, 2005 (5). • Bao, Shuming and Wing Thye Woo. 2004. Migration Scenarios and Western China Development: Some Evidence from 2000 Population Census Data. In Ding Lu and William A W Neilson (Eds.), China’s West Region Development: Domestic Strategies and Global Implications, World Scientific Publishing Co. • Démurger, Sylvie, Jeffrey D. Sachs, Wing Thye Woo, Shuming Bao, and Gene Chang. 2004. Explaning Unequal Distribution of Economic Growth among China Provinces: Geography or Policy? In: Aimin Chen, Gordon G. Liu, and Kevin H. Zhang (Eds.), Urbanization and Social Welface in China, Ashgate.. • Démurger, Sylvie, Jeffrey D. Sachs, Wing Thye Woo, Shuming Bao, Gene Chang and Andrew Mellinger, 2002. Geography, Economic Policy and Regional Development in China. In: Asian Economic Papers, Vol. 1 (1). • Démurger, Sylvie, Jeffrey D. Sachs, Wing Thye Woo, Shuming Bao, and Gene Chang, 2002. The Relative Contributions of Location and Preferential Policies in China’s Regional Development: Being in the Right Place and Having the Right Incentives. In: China Economic Review, Vol. 13: 444-465. • Bao, Shuming, Gene Chang, Jeffrey D. Sachs, and Wing Thye Woo. 2002. Geographic Factors and China’s Regional Development Under Market Reforms, 1978–98. In: China Economic Review, Vol. 13:89-111.
http://Chinadatacenter.org http://Chinadataonline.org