Download
1 / 26
270 likes | 274 Views
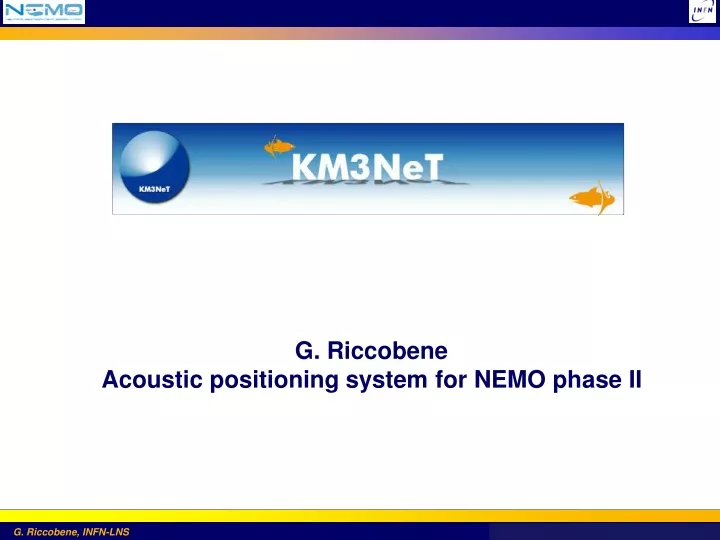
G. Riccobene Acoustic positioning system for NEMO phase II. Overview. Acoustic positioning system is mandatory for the detector The frequency range of intereset for acoustic positioning is 10-40 kHz The freqeuncy range of interest for acoustic neutrino detection is f<80 kHz

E N D
G. Riccobene Acoustic positioning system for NEMO phase II
Overview Acoustic positioning system is mandatory for the detector The frequency range of intereset for acoustic positioning is 10-40 kHz The freqeuncy range of interest for acoustic neutrino detection is f<80 kHz Hydrophones are large bandwidth sensors We can use the same sensors for both goals All data to shore data rate fully sustainable with NEMO-like electronics The array must be calibrated in amplitude and time (OK for the NEMO-like DAQ system)
Ambient noise definition and spectra • Ambient noise is generally made up of three constituent types: • wideband continuous noise, tonals and impulsive noise • Impulsive noise: transient, wide bandwidth and short duration. It is best characterised by quoting the peak amplitude and repetition rate. • Continuous wideband noise: normally characterised as a spectrum level (in a 1 Hz bandwidth) intensity in dB relative to a reference level of 1µPa • Tonals: very narrowband signals, usually characterised as amplitude in dB re 1µPa and frequency. Knudsen Urik turbolence tides sea surface shipping
Acoustic positioning in NEMO-Phase 1 15 m Acoustic positioning board 200 kHz digitization 300 m Beacon Long Base Line In NEMO Phase 1 a commercial acoustic positioning system was used (ACSA). Acoustic poisitionig board with DSP onboard: acoustic signal analysis underwater detection time sent to shore to recover hydrophone position. GPS Time packet Signal detection time Acoustic positioning PC Beacon
Acoustic positioning Long Baseline (NEMO Phase 1) Battery Beacon 350 m Battery Beacon Mini Tower with 4 floors 8 acoustic receivers and a monitoring station 350 m 350 m e.o. cable Beacon On Tower Battery 350 m Beacon On Junction Box Beacon e.o. cable Distances between beacons were calculated with ROV and GPS
Acoustic positioning: Measurement Principle Hydrophone BEACON MEASUREMENTS SYNCHRONIZATION BEACON TOWER BASE BEACON BEACON Times are syncrhonized The monitoring station is still on the sea-bed Resolution ~15 cm
ACSA TSSC Patent Beacon TSSC code Delay time from monitoring station time time A custom code based on TDOA recovers hydrophone position Sound velocity profile recoverd from CTD
Performances of the system Calculation of distance beetween H0-H1 on Floor 2 Measured distance in laboratory = 14.25 m Mean value = 14.24 m (each point is averaged in 5 minutes)
Acoustics in NEMO Phase 2 NEMO - Phase 2 • NEMO Phase II: Installation and operation of a “full scale” tower in Capo Passero Site • 16 floors, 64 Optical Modules, 750 m total height • Same electronics and DAQ and DAT as NEMO Phase I: • All detectors data synchronised and phased (about 1 nsec) • 32 hydrophones used mainly for Acoustic Positioning and also for Acoustic Physics/Biology • Reduce costs and improve reliability of the tower acoustic positioning system • O(1km) long antenna for feasibility studies on acoustic detection • Optical and acoustic data in the same data stream with the same timing • Interdisciplinary • Environment and Detector acoustic monitoring 40 m 750 m 10 m 2 PMTs, 1 hydrophone
NEMO Phase II – “Acoustic” Electronics Chain New design: we use the FCM offshore to time stamp the acoustic data A “phased and syncronised” acoustic array “All data to shore” philosophy data payload: 2 Hydros = 1 OM, fully sustainable Hydros + preamps Acoustic Data Server Floor Conrtol Module Adds GPS Time Send data to shore ADC Acoustic Physics / Biology optical fiber On-Shore Floor Conrtol Module Data Parsing Acoustic Positioning OMs
The Acoustic Board The Acou-board consists of a DAQ section and a power supply section Signal from preamp FCM interface cable: data, clock reset Preamp power ADC Crystal CS-5381 Max input 2 VRMS 5 V power supply
Tests : noise floor (AcouBoard and FCM) 0 dB = 2 V RMS 32000 pts FFT no average
Test with the whole chain: noise floor 0 dB = 2 V RMS 32000 pts FFT no average
Measurement of the latency Time of trigger known ( accuracy < ns ) FMC off-shore Insert time in data FMC on-shore Optical link Trigger Signal (time known) Acoustic Board (sampling) Acoustic Data acquisition board Signal generator Latency Measuremnet = 170 us ± 100 ns For all boards preamp preamp sinus
Hydrophone Amplitude Calibrations at High Pressure Commercial Hydrophones are typically factory calibrated: piston test at 250 Hz, water pool test above 5 kHz (due to reflections) directionality pattern But for many hydrophones sensitivity change as a function of pressure (about 10 dB less at 3500 m) NEMO and an italian company (SMID)have developed low cost hydrophones for 4000 m depth, with no change of calibration as a function of depth. NATO has developed for / with NEMO a standard procedure for calibration under pressure Hydros for NEMO Phase 2 (SMID) don’t show change of sensitivity at 3500 m after several cycles). Sensitivity (now poor) can be improved 300 bar / 30 kHz ping 0.1 bar / 30 kHz ping
NURC Acoustic calibration facilities Calibration Tank • Tank dimensions: 4.6m long, 3.6m wide, 2.7m deep • Crane: Wall mounted, 500kg capacity • Rotators: • 2 units, 50kg and 500kg capacity, 0.1 degree resolution • Instruments: • PC with National Instrument PXI 6115 DAQ card & GPIB • HP 33120a signal generator interfaced through GPIB bus • Stanford Research Systems DG 535 delay generator • Stanford Research Systems SRS 560 pre-amplifier • Instruments Inc L2 power amplifier
NURC Tests Set-up for high pressure tests • Hydrophone placed in pressure vessel filled with oil & immersed in a calibration tank • • A projector (ITC1042) is placed at approximately 1m from the pressure vessel • • Pressure is increased to 400 bar and allowed to settle for 30 minutes. • • Hydrophone signal is acquired at 400, 300 and 50 bar. Relative Hydrophone sensitivity variation with hydrostatic pressure at 20kHz Calibration curves (32 hydros) in water tank
“Acoustic” Data transmission Chain Sea Shore INFN Beacon ACSA ACSA
Beacon ACSA Characteristics Frequency: 32 kHz +/- 500 Hz (f may be different for different beacons) Pulse duration: 5 ms +/- 200 µs Source level: 180 dB Repetition rate: programmable TSSC sequence. Approximate rate: 1 Hz Ultra stable clock embedded – Drift & jitter < 5.10-8 Consumption: Inrush current : <220mA Run mode current : <220mA Pulse current : <220mA Maximum depth: 3600 m, External power supply option activated. Size: Diameter: < 10 cm – Length : < 50 cm.
Simulation of the positioning system Base tower Beacon 1st floor hydro Lateral Beacon 1st floor hydro Base tower Beacon 1st floor hydro Beacon signal at source 32 kHz Lateral Beacon 16st floor hydro Knudsen's relation: SPD (fHz, SS) ≈ 94,5 – 10 log f5/3 + 30 log (SS +1) re μPa2/Hz
Simulation beacon signal over Sea Noise • Beacon signal over background • SS= 5 • 16th floor Tower base beacon Other beacons (TSSC) Correlation of acquired signal with the original beacon signal
Common work with CPPM and Valencia Install a couple of recieving/transmitting hydrophones on 1 floor: The pulse emission time is triggered by the FCM pulse emission time and pulse reception time on other hydrophones are known with a precision better than 1 usec.