Download
1 / 28
280 likes | 285 Views
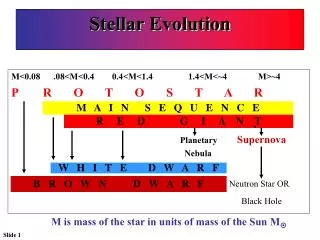
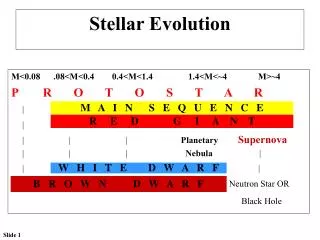
Lec 6. II-8 Stellar Evolution (Main Ref.: Lecture notes; Parts of FK Sec. 16-1,2, Ch 18, 19, 20; CD photos shown in class) II-8a. Introduction (Main Ref.: Lecture notes; FK p.505, p. 533, p. 563, Sec. 18-1).

E N D
Lec 6 II-8 Stellar Evolution (Main Ref.: Lecture notes; Parts of FK Sec. 16-1,2, Ch 18, 19, 20; CD photos shown in class) II-8a. Introduction (Main Ref.: Lecture notes; FK p.505, p. 533, p. 563, Sec. 18-1)
Understanding how stars evolve requires bothobservation and ideas from physics • Because stars shine by thermonuclear reactions, they have a finite life span • The theory of stellar evolution describes how stars form and change during that life span
II-8b. Early Stages (Star Formation) and Middle Age (Main Sequence) (Main Ref.: Lecture notes; FK, Sec. 16-1,2, 18-2 through 8, 19-1) (i) Interstellar Nebulae(Main Ref.: Lecture FK Sec. 18-2,3;CD photos shown in class) Interstellar gas and dust pervade the Galaxy •The interstellar matter (ISM) filling the space between stars is not homogeneous nor uniform, but clumpy – there are denser regions like clouds. These denser regions are generally called interstellar `Nebulae’. (Note: there are other kinds of nebulae, too, e.g., planetary nebulae, matter surrounding supernovae, etc., but we will come back to them later.) • There are three kinds of interstellar nebulae - dark nebulae, emission nebulae, and reflection nebulae. We will briefly summarize these nebulae.
Dark Nebulae - Black: • Dark nebulae are cool gas and dust so dense that they are opaque. They appear as dark blots against a background of distant stars when they are in our line of sight • stars are born there! • Examples:, Barnard objects, Bok globules, Horsehead nebula in Orion, Barnard 86. See CD pictures in class, and Fig. II-42, 43, 45, 46, 47, 48. • Why dark? Because dust grains and cool gas are dense enough to block the way of light from background stars, emission nebulae, HII regions, etc. (See class notes for how it works.)
Emission Nebulae – Bright Red: • Emission nebulae, or H II regions, are glowing, ionized hot clouds of gas. Emission nebulae are powered by ultraviolet light that they absorb from nearby hot stars Example: Orion Nebula, Rosette Nebula See CD pictures in class, and Fig. II-42, 43, 48. Why Bright Red? Because near-by bight, hot young stars, e.g., O, B stars just born, illuminate a cloud of hot gas by UV light and heat up the gas. Most abundant element of the gas (~ 74%) is Hydrogen (H). When the gas heats up, the neutral H atom (= HI) is ionized (electron escapes) and become singly charged H ion, H+ (= proton p = HII). When H ion becomes H atom again by recombination,
photons are emitted in a cascade. The recombined electrons are now bound to proton, and jump down from higher energy levels to lower ones, emitting Balmer emission lines, which are in the visible range. The most prominent line is H, which comes in red, and so Red Color! (See class notes for further details.) • Reflection Nebulae - Blue: • Dense, cool cloud of gas and dust grains, NOT in our line of sight, reflects light from near by stars, HII regions, etc. Example: NGC 2023 in Orion Nebula, Pleiades. See CD pictures in class, and Fig. II-43, 44, 48. Why blue? Because the dust grains and gas in the dense cloud are too cool to emit light by itself (unlike emission nebulae), but can reflect light from near-by stars and HII regions. We can see the reflected light if the cloud is not in our line of sight. Looks blue because more blue is reflected – the same as why the sky is blue.
Note: If the cloud is in our line of sight and if it is dense enough, the cloud will appear as a dark nebula! (See class notes for how it works.) EX 28 Fig II-42: Orion Nebula
EX 29 Fig II-43: Orion Nebula Fig II-44: NGC 6726-27-29
EX 30 Fig II-45: a Dark Nebula Fig II-46: Bok Globules
EX 31 Fig II-47: the Milky Way Fig II-48: the Trifid Nebula
(ii) Star Formation – Protostars and Birth (Main Ref.: Lecture notes; FK Sec. 18-3 to 8; CD photos shown in class) • As already noted in Section (i), the interstellar matter (ISM) is not uniform, but clumpy. New stars are formed in these clumpy, cool, dense clouds called `dark nebulae’ in or near molecular clouds (cool clouds with CO and H2 molecules). Bursts of protostar formation takes place when these dense regions are hit by high speed (`supersonic’, meaning speed faster than the sound speed) winds from a near-by supernova explosion or UV light and winds from near-by hot O and B stars shocks protostar formation. • Physically, a dense, cool cloud of gas starts to contract due to self-gravity when a given amount of mass (hundreds of solar mass) gets smaller in size than a critical radius, called `Jean’s Radius’, RJ. During contraction the cloud fragments into smaller clouds Birth of protostars!
When a protostar contracts, gravitational energy is released. According to the Virial Theorem (to be discussed in an upper division astrophysics course, but not in this course), half of the released gravitational energy is radiated away from the surface as photons, while the other half heats up the star. So, as the contraction proceeds, the protostar gets hotter and smaller. • The protostar gets hot and luminous enough to shine when the temperature gets to about 3000 K (so it should look red). • This newborn protostar is surrounded and protected by a dense cocoon of grains and gas which absorbs visible light from the star, and so a protostar is hard to see by visible light, but it can be seen by infrared (IR) light, because IR is more transparent through the cocoon.
Since all protostars of all mass range are born at roughly ~ 3000 K, with different luminosities, they all lie along the Hayashi Track on the HR Diagram. See Fig. II-56. (See class notes for the details.) • As the protostar keeps contracting and heats up, it moves on the H-R Diagram from the Hayashi Track to the main sequence. By the time it reaches the main sequence the central temperature gets to > ~ 107 K, high enough for the H burning to start. Then, the nuclear energy can supply the source of energy lost by photons from the stellar surface, and hence, the contraction stops Birth of a Star!
EX 32 • Protostars form in cold, dark nebulae • As a protostar grows by the gravitational accretion of gases, Kelvin-Helmholtz contraction causes it to heat and begin glowing • Star formation begins in dense, cold nebulae, where gravitational attraction causes a clump of material to condense into a protostar Fig II-49: Newborn Stars in Orion Nebula
EX 33 Fig II-50: M16, a Star Cluster with Star Forming Regions
Fig II-51: How O and B Stars Trigger Star Formation • Star-forming regions appear when a giant • molecular cloud is compressed. • This can be caused by the cloud’s passage through • one of the spiral arms of our Galaxy, by a supernova • explosion, or by other mechanisms • •
During the birth process, stars both gainand lose mass In the final stages of pre–main-sequence contraction, when thermonuclear reactions are about to begin in its core, a protostar may eject large amounts of gas into spaceLow-mass stars that vigorously eject gas are called T Tauri stars EX 34 Fig II-52: Mass Loss fromYoung, Massive Stars
O and B Stars and Their Relation to H II Regions • The most massive protostars to form out of a dark nebula rapidly become main sequence O and B stars • They emit strong ultraviolet radiation that ionizes hydrogen in the surrounding cloud, thus creating the reddish emission nebulae called H II regions • Ultraviolet radiation and stellar winds from the O and B stars at the core of an H II regioncreate shock waves that move outward through the gas cloud, compressing the gas and triggering the formation of more protostars Fig II-53: Mapping Molecular Clouds
Supernovae compress the interstellar mediumand can trigger star birth EX 35 Fig II-54: SN 0103-72.6 Fig II-55: An Association
Hayashi Track • Path of protostars from the Hayashi Track to Main Sequence (MS): Figure II-56 To understand how a protostar moves from the Hayashi Track to the main sequence, it is convenient to use the Stefan-Boltzman Law: L = 4 R2 T4. Eqn(16) High mass star (e.g., 9M☉star) ~ horizontal toward left – R decreases while Ts (surface temperature) increases in such a way as to keep L ~ constant (see Eqn(16)). Fig. II 56: Evolution of Protostars
Low mass star (e.g., Sun) ~ downward first – while R decreases, Ts increase is so small that L decreases (see Eqn(16), but then, moves toward left before going down again slightly – finally increase in Ts catches up with R decrease to keep L ~ constant, and then reverses the trend again in the end, before reaching MS. See Fig. II-56 and class notes for details. Protostar Lifetime: • Short compared with the MS life time (age). • Shorter for more massive stars. • Why? More massive stars involve larger gravity contract faster reach high enough temperature for H-burning faster! M = 1 M☉. t ~ 2 x 10⁷ years, compare with t(MS) ~ 1010 years M = 15 M☉ t ~ 105 years, compare with t(MS) ~ 107 years where t(MS) = main sequence lifetime. EX 36
(iii) Middle Age – Main Sequence (MS) Stars (Main Ref.: Lecture notes; FK Sec. 16-1,2, 18-4, 19-1) • Stable and long, because: (i) Nuclear energy source, H-burning, is stable and lasts long no gravitational contraction mechanically balanced Gravity supported by gas pressure (ideal gas) . Note: Nuclear energy source ( = H-burning) stable and lasts long. (ii) Energy balance and transport: Nuclear energy released in central core = Radiation energy lost from the surface by photons, through transport from center to surface.
★Mass: Minimum Mmin ~ 0.08 M☉: Why? Because if M < Mmin , T too low (< 107 K) for H-burning no nuclear energy source star cannot shine by itself - cannot be born as a star! Maximum Mmax ~ 200 M☉: Why? Because if M > Mmax raiation pressure > gravity hydrostatic equilibrium (balance) lost star cannot be held together and exist as a stable star. ★ Zero Main Sequence (MS) Star: = MS star at t = 0 - i.e., when star was born = when H-burnng starts. Composition at t = 0: H ~74%; He ~ 25%; others (Z > 2) ~ 1%, for stars like the sun. ★ Non-Zero Main Sequence (MS) Star: = MS star at t > 0. e.g., Our Sun: M = 1 M☉; Age t = 4.6 x 10⁹ year.
H mass fraction (%) He mass fraction (%) Composition of non-zero MS stars: e.g., Center of our Sun: H ~30%; He ~ 70%; others (Z > 2) ~ 1% See Fig. II-57 (below) and class notes Fig. II-57: Internal composition of the sun Note: during t = 0 to tend, R increases by ~ 6%, L increases by ~ 40%, and Ts increases by 300K.
Lifetime (duration) for MS ~ Age of Star: Long, but shorter for more massive stars. Why? More massive MS stars are hotter H-burning proceeds more quickly, energy radiated more quickly, fuel (H) exhausted more quickly, etc. (see class notes & HR Diagram). Exmples: M = 25 M☉, tend ~ 4 x 10⁶ years; M = 15 M☉, tend ~ 1.5 x 10⁷ years; M = 3 M☉,tend ~ 8 x 10⁸ years M= 1 M☉,tend ~ 1.2 x 10¹⁰ years M = 0.5 M☉, tend ~ 7 x 10¹¹ years. See class notes and Fig. II-58 For detailed explanation. FK Fig. II-58: Stellar evolution of MS and post-MS stars
H-R Diagram:.MS star moves up and to the right or left somewhat. Hence, MS stars lie on the strip from t = 0 to tend = end of MS. Study Fig. II-58 and class notes. A star’s lifetime on the main sequence isproportional to its mass divided by its luminosity Table II-5: Main Sequence Lifetime
The duration of a star’s main sequence lifetime depends on the rate at which the hydrogen is consumed in the core and energy lost by radiation from the surface • The more massive a star, the shorter is its main-sequence lifetime Fig II-59: Main Sequence Stars of Different Masses
The Sun has been a main-sequence star for about 4.56 billion years and should remain one for about another 7 billion years During a star’s main-sequence lifetime, the star expands somewhat and undergoes a modest increase in luminosity Fig II-60: The Zero-Age Sun and Today’s Sun