Download
1 / 36
370 likes | 382 Views
Types of Data and Level of Measurements. Mohammed TA, Omar, Ph.D. PT, CLT, PGDCR Rehabilitation Health Science Department CAMS-KSU ,. Objectives. Identify types of variables in research study

E N D
Types of Data and Level of Measurements Mohammed TA, Omar, Ph.D. PT, CLT, PGDCR Rehabilitation Health Science Department CAMS-KSU,
Objectives • Identify types of variables in research study • Differentiate and discuss the mathematical model of nominal, ordinal, ratio, and interval level of measurements. • Differentiate between norm referenced and criteria referenced measures
Outline • Measurement and Variables • Levels of Measurement • Nominal • Ordinal • Ratio • Interval • Measurement erors
Measured Variables Variables are some characteristic or factor that can have different values and is either subject to change or can be manipulated as an intervention. Variablesare what are measured Variables are the data gathered during research Variables (independent, dependent, constant, confounding)
Example -1- • Effects of 12 weeks of aerobic training on autonomic modulation, mucociliary clearance, and aerobic parameters in patients with COPD Independent Variable 12 weeks of aerobic training • Autonomic modulation, • Mucociliary clearance • Aerobic parameters dependent Variable
Example -2- • The effect of aquatic exercise on spasticity, quality of life, and motor function in cerebral palsy Independent Variable aquatic exercise • Spasticity, • Quality of life, • Motor function dependent Variable
Example -3- • Therapist measures ROM, following total knee replacement to investigate effect of strengthening exercises compared to functional exercises in knee extension lag strengthening exercises /functional exercises Independent Variable • ROM knee extension • Pain • Muscles strength dependent Variable
Exercises • Determinants of Function After Total Knee Arthroplasty • Physical Therapy, 2003;83, (8), 696–706, https://doi.org/10.1093/ptj/83.8.696 • Carefully reading attached file and identify dependent and independent variables
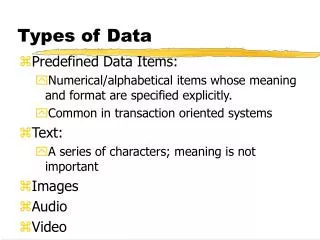
Types of data • What is Data? • Data is a collection of facts, such as numbers, words, measurements, observations or even just descriptions of things • Data is all around us. • Data is a value assigned to a thing. • Data Collection Methods • A process of collecting information from all the relevant sources to find answers to the research problem, test the hypothesis and evaluate the outcomes. • Data collection methods can be divided into two categories: • Secondary methods of data collection • Primary methods of data collection.
DATA From Data to Information to Knowledge PhD WISDOM MSc KNOWLEDGE BSc INFORMATION
Types of data • Qualitative • Describes the quality /characteristics/categories e.g. • Sex (male x females), • Eye colors ( black, green, brown), • Political affiliation (rep, Dem), • Educational level (primary ,secondary , university, MSc, PhD) • Ethnicity (Hispanic=1 Indian = 0) • Marital Status (Married =1, Divorce= 0, Unmarried =2) • Hand dominance (Left =2, Right =1). • Smoking (Smoking =1, Ex-smoker 2, Non-smoker =0) • Non-numerical format ( can be coded e.g. female=1, male=2) • Cannot use meaningfully in a computation • Two levels of qualitative data (nominal, ordinal) • Can be expressed as percentage/ frequency/mode
Types of data Quantitative • Consists of numerical value representing counts or measurements • Data in numerical quantities • Can assume all possible values • Can be computed mathematically • Two types of quantitative data ( continuous , discrete) • Two levels Quantitative data (interval, ratio) • Continuous variables: • Can be measured in fractional amount in large or small degrees • Can assume an infinite number of values between two points' • e.g. Weight, height, strength and endurance scores , girth measure) • Discretevariables • Being as whole unit , • Can not be fractional or divided • Number of studying courses • Number of student in courses
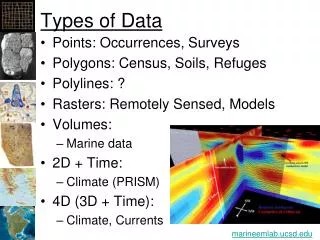
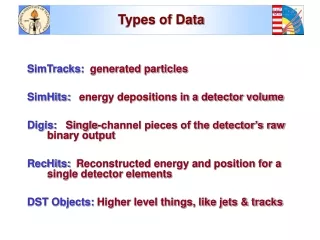
Types of Data Types of data Level of measurement
Data Collection Strategies • The strategy for data collection depends on research design • Understanding and knowing what types of data required (e.g. Qualitative vs. Quantitative) • Collect only relevant data • Established reliability & validity • Determine methods of data collection Observation, surveys, measures, questionnaires, interviews, scales
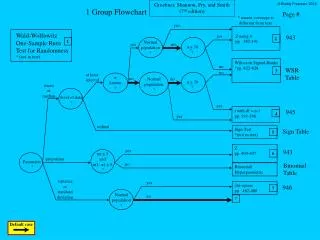
Importance of Measurement Level • Decide what statistical analysis is appropriate on the values that were assigned • Decide how to interpret the data from that variable
Measurement level: Nominal • Lowest of the four levels of measurement • Categories/classification • No order or ranking (nominal=name) • Mutually exclusive & exhaustive • May be Dichotomous/Multichotomous Statistics: Descriptive: Frequency, Percentage, Mode, Graphs: Bar Charts and Pie Charts Inferential Non-parametric
Practice in Therapy and Rehabilitation • Gender; (Male=1 and Female= 0) • Ethnicity (Hispanic=1 Indian = 0) • Marital Status (Married =1, Divorce= 0, Unmarried =2) • Hand dominance (Left =2, Right =1). • Smoking (Smoking =1, Ex-smoker 2, Non-smoker =0) • Stroke classification according to side (right=0, left=1, both=2) • Types of pain (aching, burning, stabbing) • Occupation, and Educational level • Blood groups (A, B, AB. O)
Measurement level: Ordinal • Next up power level of measurement. • Have identity and magnitude • Classifies data into categories/ ranked/ order • Distances between attributes (unequal & unknown) • Does not make sense to do calculations Statistics: Descriptive: Frequency, Percentage, Mode, Median, Quartiles Graphs: Bar Charts and Pie Charts Inferential Non-parametric
Measurement level: Ordinal Four people ran in the race We know the order they finished in 1 2 3 4
Practice in Therapy and Rehabilitation • Five point scales for manual muscle test • Manual muscles test (MMT) • Numerical rating pain scales • Functional Independence Measure (FIM) • Barthel Index(BI) Ability to perform ADL 1 = completely dependent 2 = needs human assistance 3 = needs mechanical assistance 4 = completely independent Functional assessment scales 0 = Dependent, 1 = need Physical assistance 2=independence
Measurement level: Interval • Same rules as ordinal (ranked & ordered) • Assume equal distances between values, • No absolute zero (zero point is arbitrary) • Differences make sense, but ratios do not. • Mathematical operations (subtraction, multiplication & division). Statistics: Descriptive Mean & standard deviation (SD) Graphic: Histograms , Stem-and-Leaf plots Dot Plots, Box plots XY Scatter Plots (2 variables). Inferential Parametric
Practice in Therapy &Rehabilitation Temperature : The distance, for example, between a joint angle of 10° and 18° is the same as the difference between 25° and 33°. IQ tests (interval scale). Functional status test
Measurement level: Ratio • Highest level for measurement • Meets all rules of interval level, • Absolute zero point • Can construct a meaningful ratio (fraction) Statistics: Descriptive Mean & standard deviation (SD) Graphic: Histograms , Stem-and-Leaf plots Dot Plots, Box plots XY Scatter Plots (2 variables). Inferential Parametric
Practice in Therapy &Rehabilitation • Walking distance in meter • Force of muscle contraction in Newton-meter. • Age, Height, & Weight. • Temperature in Kelvin • Speed ,volume. • Isokeintic • Pulmonary function test
Practice -1- Please reading carefully the assigned paper and then apply the concept related to 1-Different types of variables • Independent variable, • Depended variables , 2- Different Level of measurements (nominal , ordinal, ratio, interval) for each variable
Practice -1- • Higher versus Lower Positive End-Expiratory Pressures in Patients with the Acute Respiratory Distress Syndrome N Engl J Med 2004;351:327-36. • Immediate effect of a functional wrist orthosis for children with cerebral palsy or brain injury: A randomized controlled trial Available online 28 October 2017 In Press, Corrected Proof
Practice -1- • Determinants of Function After Total Knee Arthroplasty • Physical Therapy, 2003;83, (8), 696–706, https://doi.org/10.1093/ptj/83.8.696 • Carefully reading attached file and identify dependent and independent variables
Measurement Error Picture (b) on the right shows the scale reads 1.2 pounds when empty, introducing a systematic error that makes all measurements 1.2 pounds too high Picture (a) on the left represents a baby’s motion, which introduces random errors to the measurement process
Measurement error The term ‘ERROR’ does not necessarily mean that something is being done INCORRECTLY; rather it refers to the variability in the technique of the person operating the instrument or making the measurement. Every Measurement Contains Errors
Sources of Measurement Errors Conditions of Test Administration and Construction Conditions of the Person Taking the Test • Changes in time limits • Changes in directions • Different scoring procedures • Interrupted testing session • Qualities of test administrator • Time test is taken • Sampling of items • unclearness in wording of items/questions • Climate of test situation • (heating, light, ventilation, etc.) • Differences in observers • Reaction to specific items • Health • Motivation • Mood • Fatigue • Luck • Memory and/or attention fluctuations • Attitudes • Test-taking skills (test-wiseness) • Ability to understand instructions • Anxiety