Download
1 / 10
100 likes | 105 Views
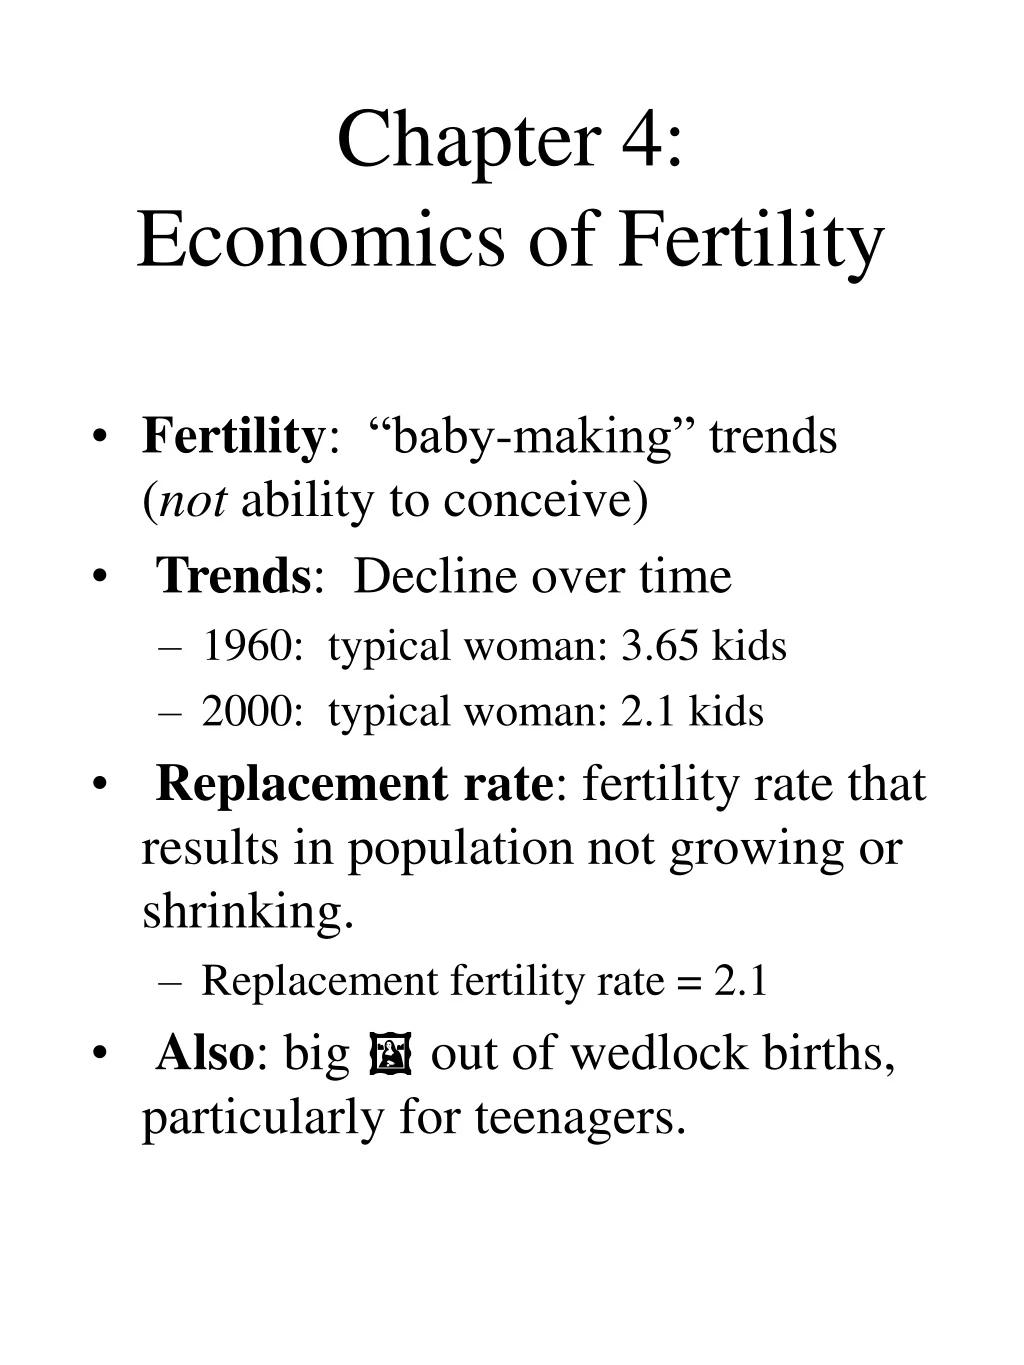
Chapter 4: Economics of Fertility. Fertility : “baby-making” trends ( not ability to conceive) Trends : Decline over time 1960: typical woman: 3.65 kids 2000: typical woman: 2.1 kids Replacement rate : fertility rate that results in population not growing or shrinking.

E N D
Chapter 4:Economics of Fertility • Fertility: “baby-making” trends (not ability to conceive) • Trends: Decline over time • 1960: typical woman: 3.65 kids • 2000: typical woman: 2.1 kids • Replacement rate: fertility rate that results in population not growing or shrinking. • Replacement fertility rate = 2.1 • Also: big out of wedlock births, particularly for teenagers.
Terms to Describe Fertility Trends • Can use more specific data for specific age groups, races, or marital states. • See Table 1: • Birth rate; • Fertility rate; • Non-marital fertility rate; • Total fertility rate; • Non-marital birth ratio. • Previous overhead: • Total fertility rate = # births avg woman today would have over lifetime if she had the age-specific fertility rates that prevail today.
Fertility Trends Over Time • See Figure 1: learn to read two-component graphs with two different vertical axes. • Fertility rate (births per 1000 women): • Baby boom: 1945-1964; • Baby bust: big decline in 60s and early 70s; • Near stability since then. • Total Fertility Rate: • At peak of boom: 3.5 kids • At bottom of bust: 1.7 kids
Non-marital Fertility Trends • See Figure 2: • Steady from 1940 thru 1970 (a 300% ); • Then more in 1980s and early 1990s; • Currently 44 to 45 births per 100 single women. • See Figure 3: • Shows % of all births that are to single women.; See huge ; • 1940: 4% ; 1990s: 33%; • Trend actually from multiple factors (I.e., marriage rates, including cohabitation; marital fertility).
Fertility Trends by Race • See Table 2: • Fertility rate similar across race/ethnicity. • Non-marital fertility varies by race; • See % of all births to unmarried woman. • Note: difference by in this % is over time. • Note: Hispanic is an ethnicity so listed by itself but individuals in this group appear in specific racial groups also.
International Fertility Trends • See Table 3: • See for every country listed. • In some countries: serious policy concern (ex. Italy). • Lesser developed countries: • Average = 5.1 but also is . • Key link: education levels associated with fertility. • High non-marital fertility rates: • Iceland: 64% • Sweden: 54% • France: 40% • Italy: 9% • Japan: 1%
Thomas Malthus: developed 1st economic approach to fertility. • Theory: • Food supplies increase arithmetically while population increases exponentially so eventually the population becomes unsustainable and we all starve. • Economics as dismal science. • Key Points: • Contribution: linked economic variable (wage) to marriage fertility • Missed link: • wage affects marriage decision then kids come automatically; • failed to model fertility explicitly so missed connection between wages and fertility.
Modern Economic Analysis of Fertility • Becker (early 1960s): • “An Economic Analysis of Fertility” • Basic point of model: • Most adults would like to have children; they utility from their kids. • Theoretical model tells us that decision to have kids is influenced by parents’ wages but model cannot predict direction of relationship (positive or negative). • Mom’s wage: • value of her time so cost of her spending time with kids and paid work kids. • But also ability to buy all goods including stuff for kids kids.
Quantity/Quality Trade-off • If a family has same amount of $$ to spend on kids: might want to have lots of kids but spend little on each one OR have few kids but spend more on each kid. • So if became easier to provide better quality relative to increasing # kids, might want fewer kids.
So WHY Has Fertility Fallen? • Rising real wages for women that has caused work by women plays a role if rising family income component causes quality. • Improvements in birth control. • female education that delays fertility. • Movement of women into professional occupations that delays fertility.