Download
1 / 2
20 likes | 99 Views
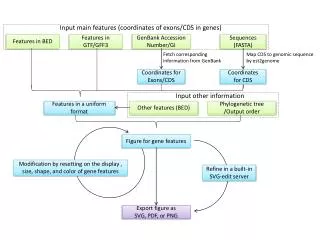
Quality filtering using ConvertGerald Convert reads to fasta format. Extract coordinates for exon, transcript, gene, non-coding regions. Align reads to the genome (with Eland software ) allowing up to10 perfect alignments up to 5 alignments with 1-mismatch

E N D
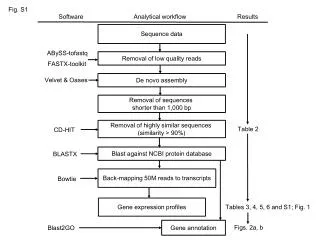
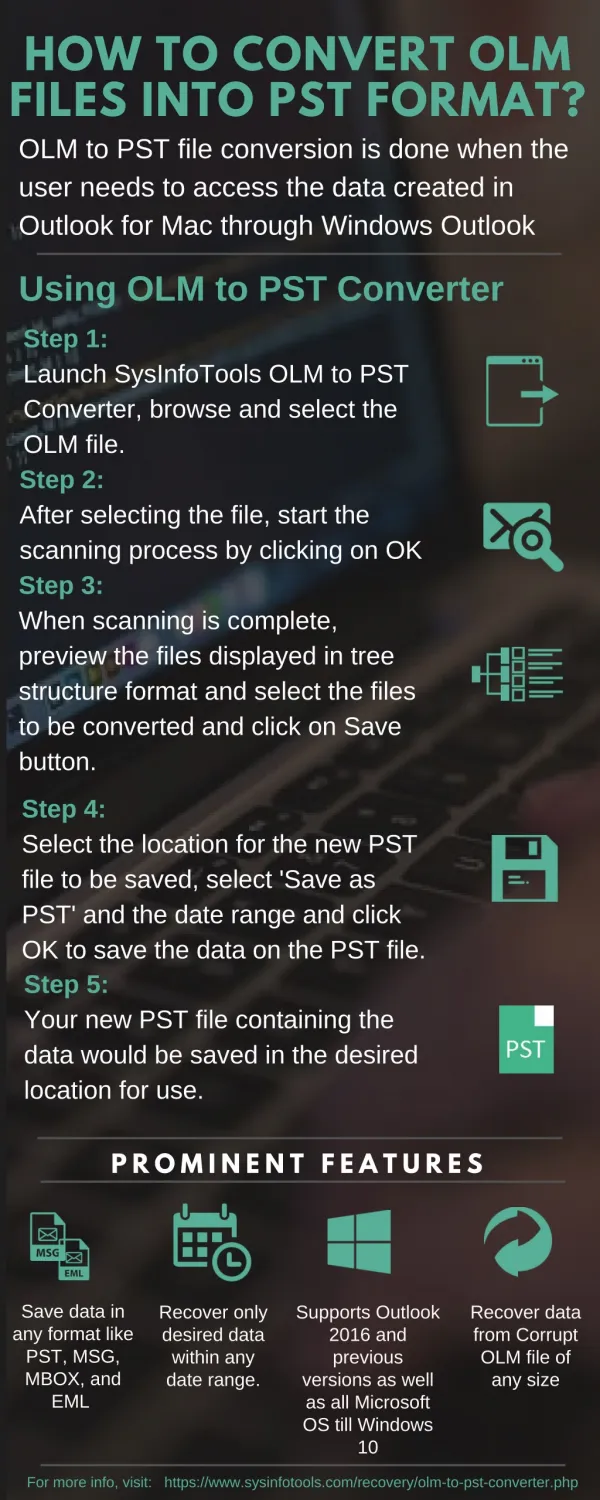
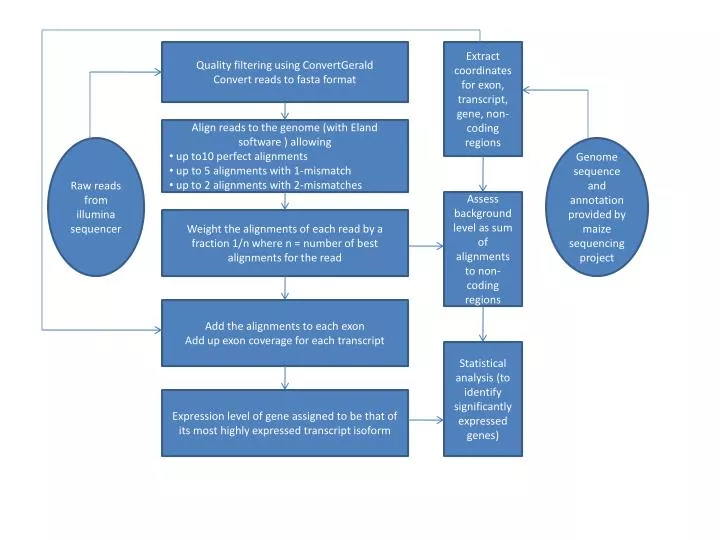
Quality filtering using ConvertGerald Convert reads to fasta format Extract coordinates for exon, transcript, gene, non-coding regions • Align reads to the genome (with Eland software ) allowing • up to10 perfect alignments • up to 5 alignments with 1-mismatch • up to 2 alignments with 2-mismatches Raw reads from illumina sequencer Genome sequence and annotationprovided by maize sequencing project Assess background level as sum of alignments to non-coding regions Weight the alignments of each read by a fraction 1/n where n = number of best alignments for the read Add the alignments to each exon Add up exon coverage for each transcript Statistical analysis (to identify significantly expressed genes) Expression level of gene assigned to be that of its most highly expressed transcript isoform
Run GERALD pipeline to convert bustard quality scores and sequences to a single fastq format • Align reads to the genome (with Tophat software which uses the Bowtie mapper) • http://tophat.cbcb.umd.edu • Pre-built indexes for the A.thaliana genome (splice junctions), but can build for any reference genome • Uses GFF files provided by TAIR Raw reads from illumina sequencer Output = .SAM file and RPKM Statistical analysis (to identify significantly expressed genes)