Download
1 / 46
500 likes | 745 Views
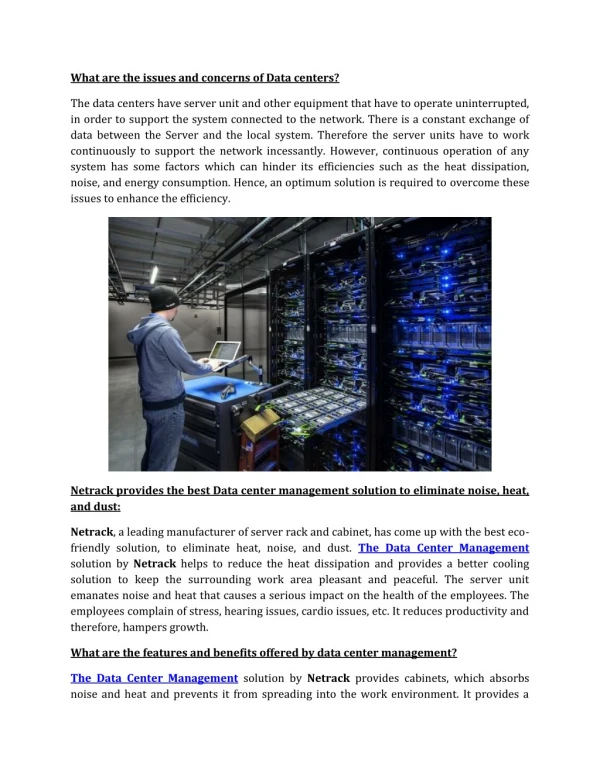
Data Center Thermal Management and Efficiency. Jay Ries Regional Sales Manager Liebert Thermal Management Emerson Network Power . Agenda. Where is energy consumed in the data center? Energy consumption example Cooling energy consumption breakdown Strategies for saving energy

E N D
Data Center Thermal Management and Efficiency • Jay Ries • Regional Sales Manager • Liebert Thermal Management • Emerson Network Power
Agenda • Where is energy consumed in the data center? • Energy consumption example • Cooling energy consumption breakdown • Strategies for saving energy • Low cost strategies • Medium cost strategies • Higher cost strategies • Taking it a step further (beyond cooling) • Summary
Where is Energy Consumed in the Data Center? 48% is consumed by power and cooling support 52% is consumed by IT equipment
Energy Consumption Example • Energy Consumption Example • Baseline Building design • Existing building • Limitation to physical changes that can be made • Best suited for modifications to existing equipment • Full equipment replacement is a last resort • 1MW of facility power usage (all data center) • Baseline Cooling design • Centrifugal water cooled chiller • No economization • Standard computer room cooling units • No variable speed fans or advanced controls • Return air control • 45° F chilled water • 72° F return air, 50% RH
Energy Consumption Example • Energy Consumption Example • Power Usage • Processors – 150kW • Other Services – 150kW • Server Power Supply – 140kW • Storage – 40kW • Communication Equipment – 40kW • Cooling – 380kW • UPS – 50kW • MV Transformer and Switchgear – 30kW • Lighting – 10kW • PDU – 10kW • IT Power Usage = 520kW • Support Power Usage = 480kW • Total Facility Power Usage = 1000kW • Annualized Facility PUE = 1.92 Work our way to 1.35 Cooling is the only area that will be modified. In the real world, each variable will have an impact on the others
Cooling Energy Consumption Breakdown Air Cooled System Water Cooled System Chilled Water System
Low Cost Strategies • Implementing best practices • Adjust the unit control methods • Dew point control • Unit operating range • Change to supply air control • Running at higher chilled water temperatures
Low Cost Strategies1. Implementing Best Practices • If you have a raised floor, use it properly. Underfloor resistance wastes energy. • Utilize hot aisle / cold aisle, regardless if you have a raised floor
Low Cost Strategies1. Implementing Best Practices • Get air where it is supposed to go. • Blanking panels • Fix unplanned outside infiltrations and any unecessary gaps in the raised floor • Return plenums to the cooling unit • Isolate the room, particularly if you want to control humidity
Low Cost Strategies2. Adjust Unit Settings • Dew Point • Standard design points used to be 72° return air temperature and 50% relative humidity (RH) • New, more aggressive design points can be 90°+ return air temperature and an unspecified relative humidity • Why shouldn’t you fix at 50% relative humidity (RH) • Dew point @ 72°, 50% = 52° • Dew point @ 95°, 50% = 74° • If the return temperature is increased at a fixed RH, the dew point will rise, requiring the equipment to waste energy to remove moisture that didn’t need to be there in the first place
Low Cost Strategies2. Adjust Unit Settings • Unit operation settings • Expanding the operating range for the temperature and humidity keeps unit components from cycling too frequently. • Higher return air temperatures allow CRAH units to run more efficiently • Capacity increase up to 70% for chilled water units • Capacity increase up to 50% for compressor based units • The more efficiently the units operate, the fewer that are required to control the space, saving energy.
Low Cost Strategies2. Adjust Unit Settings Increased Capacity at Higher Temps
Low Cost Strategies3. Supply Air Control • Supplies a consistent temperature to the cold aisle • Saves energy because it allows the return air temperature to be increased, allowing the CRAH unit to run more efficiently.
Low Cost Strategies4. Running At Higher Water Temperatures • 45° chilled water temperature has been the standard design point for many years • Higher chilled water temperatures are starting to become more prevalent • Why? At higher temperatures, there are huge potential savings on the chiller • For every 1 degree increase in the chilled water supply temperature, a 2% energy savings can be realized on the chiller plant • 45°chilled water = Baseline • 55°chilled water = 20% energy savings
Low Cost StrategiesThe Results of Implementation • Applying Low Cost Strategies • Changes to cooling system • Best practices implemented • Supply air control • 50° F chilled water • 85° F return air with dew point control • Support Power Usage = 480kW • Total Facility Power Usage = 1000kW • Annualized Facility PUE = 1.92 Total cooling power usage drops from 380kW to 314kW. The number of units stay the same, but some units can be turned off. 414kW 934kW 1.79
Medium Cost Strategies • Variable speed fan retrofits (EC Fan / VFD) • Aisle containment • Control retrofits • Rack level sensors
Medium Cost Strategies1. Variable speed fan retrofits (EC Fan / VFD) • Floor-mount cooling fans typically run at 100% rated rpm • By utilizing variable speed technology, fan speed can be varied based upon room conditions • Energy savings based on a single 10HP motor
Medium Cost Strategies2. Aisle Containment • Allows for proper air separation • Able to be done either the hot or cold aisle, though it is easier to retrofit the cold aisle of an existing room • Physical containment varies from simple curtains to a pre-fabricated system designed to match the racks.
Medium Cost Strategies2. Aisle Containment • Containment Strategies • Contained hot aisle • Requires full containment to trap hot air • Can be difficult to retrofit in perimeter designs • Easier to retrofit in row cooling designs • Overhead fire suppression concerns on full containment • Contained cold aisle • Multiple containment options • Doors only • Curtains only • Full containment • Can be easier to retrofit in all cooling designs • Overhead fire suppression concerns on full containment
Medium Cost Strategies3. Control Retrofits • Allows for upgraded control schemes that save energy • New controls allow units to be networked together • Give more visibility of full system • Eliminate fighting of units, - one cooling while one is heating
Medium Cost Strategies4. Remote Sensors • Usually associated with a control retrofit or a designed scheme through a building management system • Increased visibility and quicker reaction to changes at the rack • Generally applied with supply air sensors “Bath tub effect”
Low + Medium Cost StrategiesThe Results of Implementation • Applying Low + Medium Cost Strategies • Changes to cooling system • Best practices implemented • Supply air control • +55° F chilled water • +90° F return air with dew point control • + Remote sensors • + Aisle containment • + Variable speed fans • + Control retrofits • Support Power Usage = 414kW • Total Facility Power Usage = 934kW • Annualized Facility PUE = 1.79 Total cooling power usage drops from 314kW to 184kW. All units are now on, running at a reduced speed. 284kW 804kW 1.55 ROI is generally less than 1 year for these strategies
Higher Cost Strategies (Major Capital Expenditures) • Bringing cooling closer to the source • Variable capacity compressors • Economization • Air economizers • Water economizers • Refrigerant Economizers
Higher Cost Strategies1. Bringing Cooling Closer to the Source Rear door configuration Row-based configuration Rack-based configuration • Bring the cooling closer minimizes the need for large fans, reducing energy • Some rear door designs don’t have fans, instead utilizing the server fans to move the air • Generally produce a better sensible cooling to power ratio than a typical system – more cooling for less energy
Higher Cost Strategies1. Bringing Cooling Closer to the Source Rack Based Solutions Pump Refrigerant Technology Dew Point Controlled Pumped Refrigerant Cooling Base Infrastructure (160 kw) Cooling Modules (mix and match)
Higher Cost Strategies1. Bringing Cooling Closer to the Source Rear Door Solutions Refrigerant Based Rear Door • Refrigerant based, rear door heat exchanger • A rear door with 10kW to 40kW of cooling • Connect up to 16 doors onto a single pumped refrigerant loop • Designed to accommodate various racks • Energy story – passive door (no fans) that uses the server fans to transfer air through the coil Performance • Provides room neutral high density rack cooling • Applicable for atypical room layouts and rooms without hot aisle / cold aisle configuration
Higher Cost Strategies1. Bringing Cooling Closer to the Source Rear Door Solutions Chilled Water Based Rear Door • Chilled water based, rear door heat exchanger • A rear door with 16kW to 35kW of cooling • Designed to accommodate various racks • Energy story – passive door (no fans) that uses the server fans to transfer air through the coil Performance • Provides room neutral high density rack cooling • Applicable for atypical room layouts and rooms without hot aisle / cold aisle configuration
Higher Cost Strategies1. Bringing Cooling Closer to the Source Row Based Solutions • Row Based Solutions • Precise temperature and Humidity control • 12” or 24” wide designs • Air, Water, Glycol and Chilled Water models • Energy efficient, load matching • Digital scroll compressor, 20-100% cooling capacity modulation • Variable speed EC plug fans • Performance • Real-time environment control • Automatic performance optimization • Adaptive component monitoring • Adjustable air baffle direction
Higher Cost Strategies1. Bringing Cooling Closer to the Source Rear door configuration Row-based configuration Rack-based configuration • Fan Energy for 30kW of Cooling Perimeter Unit = 4.24 kW Rack Based = 0.54 kW Row-Based Unit = 1.38 kW Rear Door = 0.00 kW (no fans)
Higher Cost Strategies2. Variable Capacity Compressors • Digital Scroll Compressors • Matches room load in unlimited step increments • Reliable • Not field repairable. Must be replaced. • 4-step Semi-Hermetic Compressors • Matches room load in 4 step increments • Reliable • Field repairable • Compressors w/ VFD Control • Matches room load in unlimited step increments • Reliable • Usually not field repairable. Intended for partially loaded rooms. May be used in conjunction with variable speed fans for even greater energy savings.
Higher Cost Strategies3. Economization • Air side economizers • For chilled water or compressorized systems • Utilize outside air based on dew point, minimizing compressor and/or chiller usage • Water side economizers • For chilled water systems • Uses water cooled by a cooling tower or a dry cooler (fluid cooler) in low temperature conditions to minimize chiller operation • Pumped refrigerant economizers • New technology for compressorized systems • Uses refrigerant cooled in low temperature conditions to minimize condenser and compressor operation • Similar utilization as water side economizers
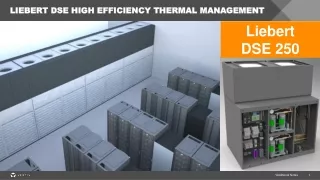
Higher Cost Strategies3. Economization – Pumped Refrigerant Reliable, Low-Maintenance Operation Liebert DSE–The Most Efficient DX Data Center Cooling System • No water usage • No water treatment • No outside air contamination • No dampers and louvers to maintain • Instant, automatic economizer changeover 60% Annual Utility Cost ($1000’s) Liebert DSE with EconoPhase Pumped Refrigerant Economizer Cooling PUE 1.3 - 1.05
Higher Cost Strategies3. Economization – Pumped Refrigerant • Liebert DSE System Overview Thermal System Manager with iCOM Liebert EconoPhase First ever pumped refrigerant economizer Liebert MC Intelligent, high efficiency condensers Liebert Proprietary Data Center Management Intelligence and Optimized Aisle Liebert DSE Indoor Unit Next generation data center cooling system
Liebert DSE System: DX Operation Mode 3.9 kW Check Valve 4.1 kW MC Condenser SolenoidValve RefrigerantPump DSE Check Valve 8.5 kW 8.7 kW Evaporator 3.2 kW 8.5 kW Check Valve 3.4 kW Circuit 2 Electronic expansion valve Circuit 1 8.7 kW Compressor
Liebert DSE System: DX + Pump Operation Mode EconoPhase 3.9 kW Check Valve 0.1kW 0.3kW MC Condenser SolenoidValve RefrigerantPump DSE Check Valve 9.8 kW Evaporator Check Valve 3.4 kW Circuit 2 Electronic expansion valve Circuit 1 0.0 kW Compressor
Liebert DSE System:Pump Operation Mode EconoPhase 3.9 kW Check Valve 4.8 kW 0.4 kW MC Condenser 0.4 kW SolenoidValve RefrigerantPump DSE Check Valve 0.0 kW Evaporator Check Valve 3.4 kW Circuit 2 Electronic expansion valve Circuit 1 0.0 kW Compressor
Liebert DSE System:Pump Operation Mode EconoPhase 3.9 kW Check Valve 0.2 kW 0.5 kW MC Condenser 0.5 kW SolenoidValve RefrigerantPump DSE Check Valve 0.0 kW Evaporator Check Valve 3.4 kW Circuit 2 Electronic expansion valve Circuit 1 0.0 kW Compressor
Higher Cost Strategies3. Economization • 1MW of IT load • 90°F return air; 20% + redundancy; No humidity control • Which is best? It depends on the customer drivers • First cost/capital cost • Energy savings/PUE • Total cost of ownership • Redundancy/availability • Reliability LIEBERT® DSE
Low + Medium + Higher Cost StrategiesThe Results of Implementation • Applying Low + Medium + Higher Cost Strategies • Key cooling system features • Supply air control • 90° F return air with dew point control • Rack level sensors • Aisle containment • Variable Speed Fans • Advanced Controls • + Pumped Refrigerant Economizers • + Variable Capacity Compressors • Support Power Usage = 284kW • Total Facility Power Usage = 804kW • Annualized Facility PUE = 1.55 Total cooling power usage drops from 184kW to 83kW. All CW units have been replaced with new units. 183kW 703kW 1.35 ROI is generally less than 3 years for these strategies
Taking It a Step Further • The annualized cooling PUE for cooling only is 1.09 for the last scenario. Why is the overall PUE 1.35? • Not implementing virtualization with the servers • Inefficiencies in the power distribution: • UPS modules • PDUs • Generators • Batteries • Switchgear • Lighting • Lack of monitoring • Not having real time data means you cannot react quickly
Taking It a Step Further • How can I get an even better cooling PUE? • Raise water and air temperatures even higher • Implement alternate technologies that remove or greatly reduce cooling • Improve server monitoring RISK PUE SERVER LOADS AVAILABILITY PUE
Implementing the Strategies • Multiple strategies to consider • Low cost • Medium cost • Higher cost • Combination of any or all of the above • Implementing any of these strategies can be somewhat difficult • Where do I start? • What can I implement? • Can the current equipment be upgraded? • Do I have budget for equipment upgrades? • Do I need outside help?
Summary • You don’t have to spend a fortune to get energy savings • However, to get to a world class level, major changes generally have to be made • Total energy consumption needs to be considered along with PUE • Focusing only on PUE can increase risk and availability • Works with some data center models, but not for all For more information on this topic, please check out the updated vendor neutral Energy Logic 2white paper, available on the Emerson Network Power website
Thank you! Questions ? jay.ries@emerson.com Or call Uptime Solutions Inc. • 937-237-3400