Download
1 / 1
10 likes | 83 Views
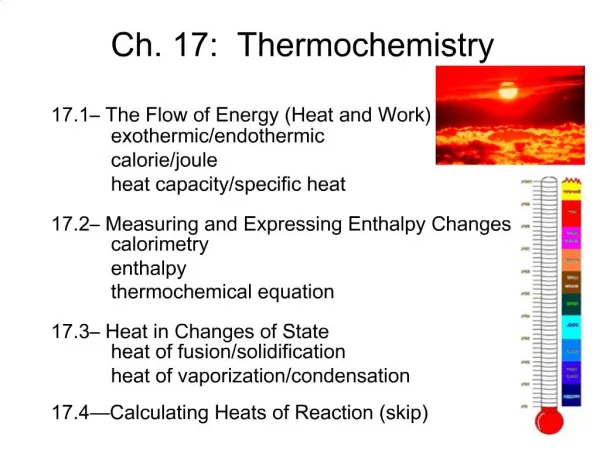
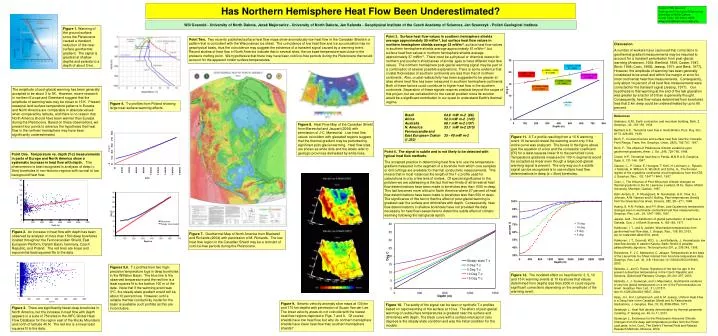
40. 35. 30. 25. 20. Deg C. 15. 10. Observed. Steady state model. 5. 0. -5. 0. 100. 200. 300. 400. 500. 600. 700. Depth m. Has Northern Hemisphere Heat Flow Been Underestimated?. Contact: Will Gosnold Geology and Geological Engineering University of North Dakota

E N D
40 35 30 25 20 Deg C 15 10 Observed Steady state model 5 0 -5 0 100 200 300 400 500 600 700 Depth m Has Northern Hemisphere Heat Flow Been Underestimated? Contact: Will Gosnold Geology and Geological Engineering University of North Dakota Grand Forks, ND 58201-8358 willgosnold@mail.und.nodak.edu Will Gosnold - University of North Dakota, Jacek Majorowicz - University of North Dakota, Jan Safanda - Geophysical Institute of the Czech Academy of Sciences, Jan Szewczyk - Polish Geological Institute Figure 1. Warming of the ground surface since the Pleistocene caused a transient reduction of the near-surface geothermal gradient. The signal is greatest at shallow depths and persists to a depth of about 2 km. Point 3. Surface heat flow values in southern hemisphere shields average approximately 50 mWm-2, but surface heat flow values in northern hemisphere shields average 33 mWm-2.surface heat flow values in southern hemisphere shields average approximately 61 mWm-2, but surface heat flow values in northern hemisphere shields average approximately 37 mWm-2. There must be a physical or chemical reason for northern and southern shield areas of similar ages to have different heat flow values. The northern hemisphere post-glacial warming signal may be part of a combination of several possible explanations. There is some evidence that crustal thicknesses of southern continents are less than that of northern continents. Also, crustal radioactivity has been suggested to be greater at sites where heat flow has been measured in southern hemisphere continents. Both of these factors could contribute to higher heat flow in the southern continents. Separation of these signals requires analysis beyond the scope of this project, but we call attention to the overall problem since its solution would be a significant contribution in our quest to understand Earth’s thermal regime. Point Two. Two recently published surface heat flow maps show anomalously low heat flow in the Canadian Shield in a pattern that is coincident with the Wisconsinan ice sheet. The coincidence of low heat flow and ice accumulation has no geophysical basis, thus the coincidence may suggest the existence of a transient signal caused by a warming event. Recent studies of heat flow in North America indicate that in several sites, the ice base temperature was close to the pressure melting point. We hypothesize that there may have been cold ice-free periods during the Pleistocene that would account for the apparent colder surface temperatures. Discussion. A number of workers have cautioned that corrections to geothermal gradient measurements may be required to account for a transient perturbation from post-glacial warming (Anderson, 1934; Benfield, 1939; Coster, 1947, Birch; 1948; Crain, 1968); Jessop, 1971; and Beck, 1977). However, the amplitude of warming has been generally considered to be small and within the margin or error for most continental heat flow measurements. Consequently, only about 14 percent of all heat flow measurements were corrected for the transient signal (Jessop, 1971). Our hypothesis is that warming at the end of the last glaciation was greater by a factor of 5 than is generally thought. Consequently, heat flow values determined from boreholes less that 2 km deep could be underestimated by up to 60 percent. The amplitude of post-glacial warming has been generally accepted to be about 3 to 5K. However, recent research in northern Europe and Greenland suggest that the amplitude of warming was may be closer to 15 K. Present seasonal land surface temperature patterns in Eurasia and North America are comparable in absolute values when compared by latitude, and there is no reason that North America should have been warmer than Eurasia during the Pleistocene. Based on these observations, we present four points to advance the hypothesis that heat flow in the northern hemisphere may have been significantly underestimated. Figure 4. T-z profiles from Poland showing large near-surface warming effects. Brazil 64.8 mW m-2 (86) Africa 52.3 mW m-2 (145) Australia 68.1 mW m-2 (157) N. America 33.1 mW m-2 (315) Fennoscandia and East European Craton 35 - 40 mW m-2 (1,352) References Anderson, E.M., Earth contraction and mountain building, Beitr. Z. Geophys., 42, 133-159, 1934. Benfield, A.E., Terrestrial heat flow in Great Britain, Proc. Roy. Soc. A173, 428-450, 1939. Birch, F., Crustal structure and surface heat flow near the Colorado Front Range, Trans. Am. Geophys. Union, 28(5), 792-797, 1947. Birch, F., The effects of Pleistocene climatic variations upon geothermal gradients, Amer. J. Sci., 246, 729-760, 1948. Coster, H.P., Terrestrial heat flow in Persia, M.N.R.A.S. Geophys. Supp. 5, 131-146, 1947. Clauser, C., P. Giese, E, Huenges, T. Kohl, H. Lehmann, L. Rybach, J. Safanda, H. Wilhem, K. Windloff, and Zothe, G., The thermal regime of the crystalline continental crust-implications from the KTB, J. Geophys. Res., 102, 18417-18441, 1997. Crain, I., The influence of Post-Wisconsin climatic changes on thermal gradients in the St. Lawrence Lowland, M.Sc. thesis. McGill University, Montréal, Quebec, 1967. Dahl-Jensen, D., K. Mosegaard, N. Gundestrip, G.D. Clow, S.J. Johnsen, A.W. Hansen and N. Balling, Past temperatures directly from the Greenland ice sheet, Science, 282, 28—271, 1998. Huang, S, H.N. Pollack, and P.Y. Shen, Late Quaternary temperature changes seen in world-wide continental heat flow measurements, Geophys. Res. Lett., 24, 1947-1950, 1997. Jessop, A.M., The distribution of glacial perturbation of heat flow in Canada, Can. J. of Earth Sciences, 8, 162-166, 1971. Kukkonen, I. T., and A. Joeleht, Weichselian temperatures from geothermal heat flow data, J. Geopys. Res., 108, B3, 2163, doi:10.1029/2001JB001579, 2003. Kukkonen, I. T., Gosnold, W.D., Jr., and Safanda, J., Anomalously low heat flow density in eastern Karelia, Baltic Shield: A possible palaeoclimatic signature, Tectonophysics 291, p. 235-249, 1998. Rolandone, F., J.C. Mareschal, C. Jaupart, Temperatures at the base of the Laurentide Ice Sheet inferred from borehole temperature data, Geophys. Res. Lett. 30, (18) 1944 (doi:10.1029/2003GL018046), 2003. Safanda, J., and D. Rajver, Signature of the last ice age in the present subsurface temperatures in the Czech Republic and Slovenia, Global and Planetary Change, 29, 241-257, 2003. Safanda, J., J. Szewczyk, and J. Majorowicz, Geothermal evidence of very low glacial temperatures on a rim of the Fennoscandian ice sheet. Geophys. Res. Lett., 31, L07211, doe:10.1029/2004GL019547, 2004. Sass, J.H., A.H. Lachenbruch, and A. M. Jessop, Uniform Heat Flow in a Deep Hole in the Canadian Shield and its Paleoclimatic Implications, J. Geophys. Res.,76; 35, 8586-8596, 1971. Szewczyk J., Heat flow density determination by thermal parameter modeling, P. Geolog.vol. 49, no.11, 2001. Szewczyk J., Evidences for the Pleistocene-Holocene Climatic Changes from the deep well temperature profiles from the Polish LowLands. In Int. Conf., The Earth’s Thermal Field and Related Research Methods, Moscow, 2002. Figure 8. Heat Flow Map of the Canadian Shield from Mareschal and Jaupart (2004) with permission of J-C. Mareschal. Low heat flow values coincident with glaciated regions suggest that the thermal gradient may be perturbed by significant post-glacial warming. Heat flow sites are shown as white dots and the labels refer to geologic provinces delineated by white lines. Figure 11. A T-z profile resulting from a 15 K warming event 10 ka would reveal the warming event only if the entire curve was analyzed. The boxes in the figure above give the equation of a line and the correlation coefficient (R2) for a least-squares linear fit to the perturbed curve. Temperature gradients measured in 100 m segments would be accepted as linear even though a large post-glacial warming signal is present. The only way such a subtle signal can be recognized is to use multiple heat flow determinations in deep (z > 2km) boreholes. Point 4. The signal is subtle and is not likely to be detected with typical heat flow methods. The accepted practice in determining heat flow is to use the temperature gradient measured in the segment of a borehole from which core samples or drill cuttings are available for thermal conductivity measurements. This means that in most instances the length of the T-z profile used for calculations is only a few tens of meters. Of special significance to the problem we are addressing is the fact that two-thirds of all terrestrial heat flow determinations have been made in boreholes less than 1000 m deep. This fact becomes more critical in North America where 87 percent of heat flow determinations have been made in boreholes less than 500 m deep. The significance of this fact is that the effect of post-glacial warming is greatest near the surface and diminishes with depth. Consequently, heat flow determinations in shallow boreholes have not provided the data necessary for heat flow researchers to detect the subtle effect of climatic warming following the last glacial epoch. Point One. Temperature vs. depth (T-z) measurements in parts of Europe and North America show a systematic increase in heat flow with depth. This phenomenon is best recognized in analyses of deep (> 2km) boreholes in non-tectonic regions with normal to low background heat flow. Figure 2. An increase in heat flow with depth has been observed by analysis of more than 1500 deep boreholes located throughout the Fennoscandian Shield, East European Platform, Danish Basin, Germany, Czech Republic, and Poland. The red lines are linear and exponential least squares fits to the data. Figure 7. Geothermal Map of North America from Blackwell and Richards (2004) with permission of M. Richards. The low heat flow region in the Canadian Shield may be a remnant of cold ice-free periods during the Pleistocene. Figures 5,6. T-z profiles from two high-precision temperature logs in deep boreholes in the Williston Basin. The blue line is the observed temperature and the red line is a least squares fit to the bottom 100 m of the data. Note that if the warming event was 3°C, the steady-state gradient would still be about 10 percent low. However, until a reliable thermal conductivity model for the basin is available such profiles as this are inconclusive. Figure 12. The modeled effect on heat flow for 3, 5, 10 and 15 K warming events at 10 ka shows that values determined from depths less than 2000 m could require significant corrections depending on the amplitude of the warming event. Figure 9. Seismic velocity anomaly slice maps at 130 km and 170 km depths with permission of Suzan Van der Lee. The lower velocity areas do not coincide with the lowest heat flow regions depicted in Figs. 7 and 8. Of course shields have low heat flow, but why do northern hemisphere shields have lower heat flow than southern hemisphere shields? Figure 10. The subtly of the signal can be seen in synthetic T-z profiles based on rapid warming of the surface at 10 ka. The effect of post-glacial warming on subsurface temperatures is greatest near the surface and diminishes with depth. The black curve with a surface intercept of zero degrees is the steady-state condition and was the initial condition for the models. Figure 3. There are significantly fewer deep boreholes in North America, but the increase in heat flow with depth appears in a suite of 759 sites in the IHFC Global Heat Flow Database for the region east of the Rocky Mountains and north of latitude 40 N. The red line is a linear least squares fit to the data.