Download
1 / 56
600 likes | 775 Views
Chapter 1: Anatomy of a cyclone. Covers … Basic state of the atmosphere Weather maps Air masses Fronts Much of the theory from the Norwegian School, Tor Bergeron, circa 1928. Weather Scales. From http :// eumetrain.org / synoptic_textbook.html. Synoptic Scale Meteorology.

E N D
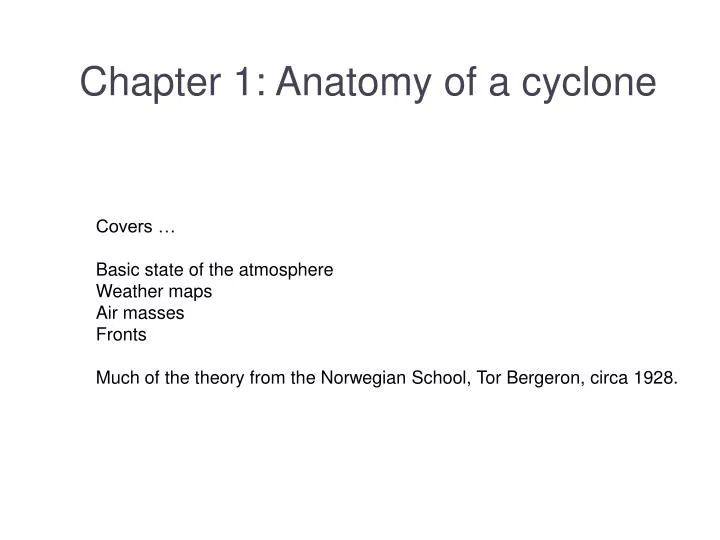
Chapter 1: Anatomy of a cyclone Covers … Basic state of the atmosphere Weather maps Air masses Fronts Much of the theory from the Norwegian School, Tor Bergeron, circa 1928.
Weather Scales From http://eumetrain.org/synoptic_textbook.html
Synoptic Scale Meteorology From http://eumetrain.org/synoptic_textbook.html
Air can be thought of as an ideal gas PV=Nkt Ideal gas law in fundamental form. Assumes molecules are point like (no volume) and interact only at short range Average kinetic energy of each molecule is: <1/2 mv2> = 3/2 kT More massive molecules (mass m) move slower on average.
Pressure drops with height It’s like being in a swimming pool; the mass of water per unit area above youdetermines the pressure you feel.
Pressure changes horizontally across the Earth Winds Newton’s laws of motion (cast for fluids as the Navier Stokes Equation),mass continuity, and the ideal gas law are used to understand fluidmotions.
Station Model for Weather Symbols 1 Knot = 1 nautical mile per hour = 1.151 mph Coded sea level pressure > 500, place a 9 in front. Coded sea level pressure < 500, place a 10 in front. So above, 229 becomes 1022.9 hPa = 1022.9 mbar. 1 hPa = 100 Pa.
Air Masses and Fronts Chapter 11 Ahrens Meteorology Review
Air Masses Extremely large body of air whose temperature and humidity are similar in any horizontal direction. Source Regions: area where air mass originates, usually flat and uniform composition with light surface winds Ideal source regions are usually those areas dominated by surface H.
Air Masses • Classification • Classification based upon temperature and humidity related to its source region. • P = polar • T = tropical • A = Arctic • m = maritime • c = continental
Air Masses • North America cP and cA • Source region: N. Canada, Alaska • Dry, cold, stable (A more extreme) • Topic: Lake Effect Snow • cP air passes over unfrozen lake, absorbs moisture and drops snow on leeward side of lake
Air Masses • North American mP • Source region: North Pacific, North Atlantic • Cool, moist, unstable • North American mT • Source region: Gulf of Mexico, Caribbean, SE Pacific • Wet, warm, unstable
Air Masses • North American cT • Source Region: SW US, Mexican Plateau • Hot, dry, stable
Two different cold events when Arctic air intruded into the lower 48
Solar radiation mixes atmosphere Radiation inversions and/orsubsidence from high pressure are associated with inversions
Invasion of cold, moist maritime polar air snow Freezing rain Light rain
January 1st 1997 Reno flooded: Warm tropical air brought rain on snow in themountains: example of atmospheric river. Note the low off the coast of Oregon. • Called the Pineapple Express
Unseasonably hot spell, Eastern US, 15-20 April 1976 Upper level flow Maximum Temperatures Upper level trough Upper level ridge
Fronts • Transition zone between two air masses of different densities • Identification on Charts • Sharp temperature change • Sharp change in dew point • Shift in wind direction • Sharp pressure change • Clouds and precipitation
Types of Fronts Cold front: Cold air advancing, warm air retreating.Warm front: Warm air advancing, cold air retreating. Stationary front: Boundary between two air masses is stationary, or nearly so. Occluded front: Separates air masses that have only a small temperature contrast,typically separates cold and cool air masses.
February 2003 Cyclone 500 mb Level Map, Approximately 5.5 km altitude. 552=5520 meters. Isotherms are dashed lines Short waves Long wave pattern Baroclinic: Isotherms crossisoheight contours. Barotropic: They are parallel.(rare). T in C, Tdew as depression, height in decimeters (tens of meters). Filled circleshave dewpoint depression < 5 C, probably cloudy. Troughs are cold, ridges warm.
A surface weather map showing surface-pressure systems, air masses, fronts, and isobars
Fronts • Stationary • Front with no movement • Winds parallel but opposite direction • Variable weather • Alternating red and blue line with blue triangles and red semi-circles • Often a cold core sits at their the surface
Fronts • Cold • Cold, dry stable air replaces warm, moist unstable air • Clouds of vertical development • Thunderstorms, squall lines (line of thunder storms) • Blue line with blue triangles
Surface weather associated with the cold front situated in the southern United States
Vertical view of the weather across the cold front Frontolysis: as temperature contrast lessens the front weakens and dissipates. Frontogenesis: if the temperature contrast increases the front strengthens.
Weak Cold Front 21 November intensifies over warm ocean water 22 November
Fronts • Warm • Warm, moist unstable air overrides cold, dry stable air • Horizontal cloud development with steady rain • Red line with red semi-circles • Topic: Dry Line • Not a cold or warm front but a narrow boundary of steep change in dew point. It separates moist air from dry air
Fronts • Topic: Wavy Warm Front • Mountain blocking path of cold air (cold air damming) causes wave shape • Occluded Front • Cold front catches up to and over takes a warm front • Cold occlusion, warm occlusion • Purple line with purple triangles and semi-circles
The formation of a cold-occluded front. The faster-moving cold front (a).
The formation of a warm-type occluded front. The faster-moving cold front in (a) overtakes the slower-moving warm front in (b). The lighter air behind the cold front rises up and over the denser air ahead of the warm front. Diagram (c) shows a surface map of the situation.
Diagram (c) shows a surface map of the situation.
A visible satellite image showing a mid-latitude cyclonic storm with its weather fronts over the Atlantic Ocean during March, 2005. Superimposed on the photo is the position of the surface cold front, warm front, and occluded front. Precipitation symbols indicate where precipitation is reaching the surface
Fronts • Upper-Air Fronts • Front aloft • Tropopause dips downward and folds under the Polar jet • Impacts surface weather
Upper Air front (Upper level front) Tropopause dips downward and foldsunder the polar jet.
Stages in the life cycle of an extra-tropical cyclone. 500 hPa contour as dashed lines young Middle age Mature stage Young: Cyclones form along the polar front Divergence occurs near the upper level short wave trough (left), promoting the cyclone,the low forms Middle: Cold and warm fronts advance, the small wave when young amplifies to forman open wave cyclone; trough forms to the left as cold air dives south, ridge as warmair intrudes towards the north; cyclone is steered NE by the 500 mb winds; upper leveltrough is tilted to the west of the surface low Mature: Cold front advances more quickly than warm front; warm air is forced aloft; occlusion occurs; now a cold core cyclone; 500 hPa trough is centered over the surfacelow and the cyclone decays.