Download
1 / 19
190 likes | 348 Views
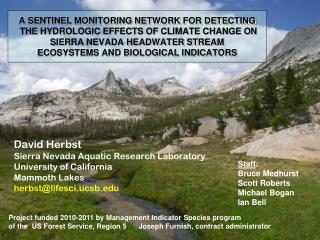
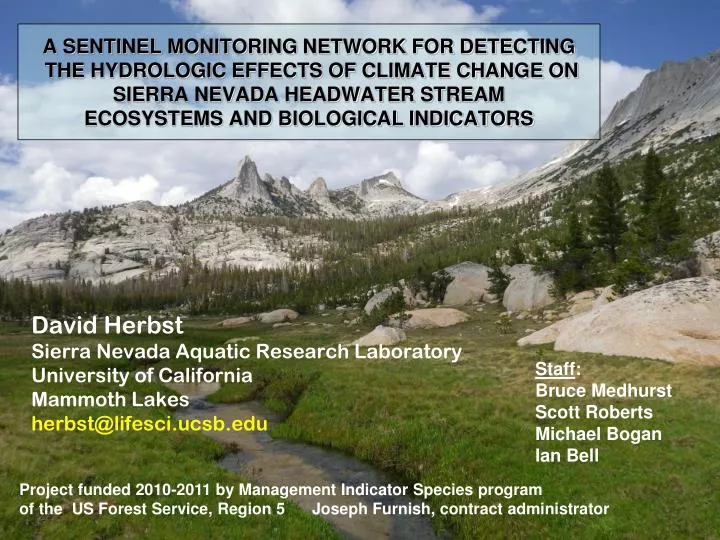
A SENTINEL MONITORING NETWORK FOR DETECTING THE HYDROLOGIC EFFECTS OF CLIMATE CHANGE ON SIERRA NEVADA HEADWATER STREAM ECOSYSTEMS AND BIOLOGICAL INDICATORS. David Herbst Sierra Nevada Aquatic Research Laboratory University of California Mammoth Lakes herbst@lifesci.ucsb.edu. Staff :

E N D
A SENTINEL MONITORING NETWORK FOR DETECTING THE HYDROLOGIC EFFECTS OF CLIMATE CHANGE ON SIERRA NEVADA HEADWATER STREAM ECOSYSTEMS AND BIOLOGICAL INDICATORS David Herbst Sierra Nevada Aquatic Research Laboratory University of California Mammoth Lakes herbst@lifesci.ucsb.edu Staff: Bruce Medhurst Scott Roberts Michael Bogan Ian Bell Project funded 2010-2011 by Management Indicator Species program of the US Forest Service, Region 5 Joseph Furnish, contract administrator
Outline Overview: • How does climate change influence mountain stream hydrology? • Why is this important to bioassessment and conservation? • Using models forecasting hydroclimatic risks vs habitat resistance features to design a monitoring network for the Sierra Nevada • Preliminary results, insights to stressors, and applications of data set Motivations for study: • Forest Service mandate: advance and share knowledge about water and climate change, and how to protect and restore aquatic habitats (Furniss et al. 2010. Water, Climate Change & Forests; USFS PNW-GTR-812) • Provide a reference stream baseline of natural conditions to produce biological health standards for Management Indicator Species program in National Forests of the Sierra (across 7 National Forests) • Evaluate the extent of reference decline or drift that might occur with effects of climate change, and use for calibration of CA-SWAMP biocriteria standards in the Sierra • Integrate climate change in planning & assessment of forest management practices using BMIs for USFS R5 • Assist “Vital Signs” and “Inventory & Monitoring” programs of National Park Service (in 3 Sierra National Parks) • Develop prioritized watershed types for resilience-building management planning based on documented vulnerability observed at sentinel streams
Headwater habitat compression: *Drying from above *Warming from below *Reduced habitat area in lower late summer flows Background • Modeling has provided some important insights and testable hypotheses on how climate change may alter the thermal and hydrologic regime of streams, but these are no substitute for real data on how aquatic life are responding • Stream flow and water temperature records show that regime changes are already underway >urgent to establish and maintain an ecological detection network • Mountain ecosystems with pronounced elevation gradients are especially vulnerable in shifting rain/snow transition zones, with habitat compression occurring in headwaters, and altered flow timing and warming occurring everywhere, all creating ecological challenges • Design of a monitoring network for detecting climate change effects on mountain streams requires use of models and landscape features to predict where and how hydroclimatic conditions will shift
Regulatory Application of Study:Biological water quality assessment programs • Programs depend on reference streams to serve as standards for assessing impaired biological integrity • But what if reference stream conditions are not stable and change beyond natural levels of variation in location and time? Assessment becomes a moving target. High quality reference sites have most to lose: • If reference values degrade and become more variable, this decreases the signal-to-noise ratio leading to loss in capability of reference condition to detect impairment • Climate change may result in reference drift >degraded condition lowers the biological standard • Need for re-calibration of bio-objectives / standards
Biologicalresponses of native benthic invertebrates to warmingand altered flow regime: • Life history/phenology: >favors shorter generations, & loss of long-lived taxa • >more generalist, fewer specialist traits • >shift to common, widespread taxa • Migration: >movement into headwater refugia? • Abundance: >warming increases growth for some but others cannot survive warming >habitat areas diminished under low summer flows (lost from food chain) • Physiological stress: >loss of sensitive species • Emigration escape: >drift in currents or flight • Dormancy: >hunker-down (resistant stages) • Shift from a perennial stream community to an intermittent type (fewer, seasonal-adapted taxa) • Local extirpation of species Developing and anticipated changes with climate warming temp rain-on-snow floods wetter & more erratic winter flows earlier snowmelt flow earlier & prolonged low summer flows periodic drying of perennial streams A Changing Hydrograph: Shift in the mountain snowmelt flow regime
DESIGN 3rd-order size watersheds of Sierra Nevada • Natural Resistance Filters: rank low to high • Northness Aspect (snowmelt timing, temp, vegetation) • Groundwater contributions (geology/springs) • Riparian cover and meadow area (water storage) Reference selection filter using GIS: mininimum roadedness or land use, no reservoirs, all above 1000 m) field reconnaissance of best candidate sites Reference 3rd-order watersheds (local impacts minimal to none) Low Risk High Resistance High Risk High Resistance Climate forecast filter: VIC-hydrological model prediction of snowpack and stream flow Low Risk Low Resistance High Risk Low Resistance 3 watersheds each category with differing exposures and expectations for the influence of climate change Ranked list of watersheds by quartiles of lowest and highest climate risk ►Designed as a natural experiment testing hypotheses of risk & resistance
surface flow SWE baseflow VIC model Output: Use Forecast Change as Risk Level Winter flows more variable With extreme flow events Surface flow lower & depleted earlier Ground snow cover less & disappears sooner Baseflow lower
Sentinel Monitoring Network for Sierra Nevada 12 catchments 24 sites total (tributary site nested in each catchment) • Selections based on summed • Climate-Risk factors from VIC: • Reduction in April 1 SWE • Change in total AMJ run-off • Change in total AMJ base-flow • upper quartile of change =high risk • lower quartile of change =low risk • Natural Resistance: • upper / lower quartiles for • North-facing = low vulnerability • South-facing = high vulnerability • Plus, resistance conferred by deep • groundwater-recharge potential from basalt / andesite geology area • (Tague and others 2008) 17 in 7 National Forests 7 sites in 3 National Parks
Tributary Reach 1° or 2° Catchment Reach 3° 20-100 km2 Nested Tributaries Monitoring Protocols: SWAMP-based 12 catchments + tributary in each: 24 stream reaches total network • Survey Monitoring data collected: • 150-m reach length • channel geomorphology • including bankfull cross-sections • (substrata-depth-current profiles, • embeddedness, slopes, bank and • riparian cover, riffle-pool ratio, etc) • conductivity, alkalinity, SiO2, pH • large woody debris inventory • cobble periphyton (Chl a, taxa IDs) • CPOM & FPOM resources • macroinvertebrates (RWB & TRC) • adult aquatic insect sweeps • photo-points
Instrumentation set up at monitoring stations: Upper Bubbs Stage-level pressure transducers and Temperature probes at catchment reaches (water and air) 90 min recording intervals Temperature probes at tributary reaches and Stage-level probes GIS Analysis at each: Land use, Roads, Geology, Riparian, Meadow & Forest cover, Groundwater recharge Analysis of logger data: Hydrographs and flow metrics Flow-separation curves (baseflow) Thermal profiles Tyndall
Streams in the southern region are at mid-to-high elevations, with low levels of conductivity and dissolved silicate (snow-melt dominated) Streams in the northern region are at lower elevations, with higher levels of conductivity and silicate (groundwater mineral content) Northern streams support higher levels of biological diversity than in the south w/o M&Ms
Climate Change Distance (Objective Function) 3.9E-03 8.1E-02 1.6E-01 2.3E-01 3.1E-01 Information Remaining (%) 100 75 50 25 0 Butte Willow McCloud EF Moosehead EF Nelson Cat Robinson Grassy Swale MFCosumnes Sagehen1 Sagehen2 Nelson Warner Cathedral Upper Cathedral Deer Pitman Snow Corral Crown Tyndall Upper Bubbs Forester Upper Tyndall SF Tamarack ~350 taxa identified to date Incl.M&Ms Community Similarity Groupings North of Yosemite Yosemite and South Intermittent channel = shortest upstream length, low SiO2 snowmelt
Closer look at Intermittent flow: stress of periodic summer drying >perennial upstream length used as indicator of dependable flow Short headwater streams most susceptible, having least taxa richness. But what protects some headwaters and not others? >Groundwater inflows (higher SiO2) sustain baseflow and resist drying >low SiO2 snowmelt-dominated streams risk drying but support more richness as channel length increases (=perennial flow)
Statistical equivalence of treatment groups: Group with most risk and vulnerability also has the most scope for response. All groups exceed the Sierra reference level for maximum EPT = 23 taxa [blue line eastern Sierra IBI] Biodiversity present in treatment groups have similar initial richness levels for 2010, a near-average water year > So there is diverse scope for response • Trait Character States: • 79% of these taxa are cold-adapted* • 89% are either semi- or uni-voltine (have ≥1 yr life cycles) • 67% prefer riffle habitat (high flows) • *except intermittent stream just 50% =Baseline for further comparisons
Flow Regime Types Observed*(habitat ecological templates, after Poff and others)Are there associated BMI community types? • 1. Stable winter flows and temperatures during ice cover (though R on S may occur), rapid spring snow-melt and summer recession, prolonged cool temps (<10ºC) • 2. Winter rain and snow, instable ice-snow cover, rising flows through winter and spring, warm summer temperatures (≥15ºC) • 3. Stable groundwaters sustain high flows and cooler more constant temperatures (≤10ºC) • 4. Spatial intermittent flows, losing reaches, warm, variable *1. Snow 2. Rain+Snow 3. Groundwater 4. Intermittent-Flashy
2011: high and prolonged spring runoff and water chemistry change: lower pH (-0.75 mean) Wilcoxon signed-rank paired comparison 2010 to 2011 p<0.0001 (22 of 24 streams), decreasing from an average of 7.22 to 6.47 pH decrease with high runoff dilution of inflows, most severe at streams with lower pH and less acid neutralizing capacity Biological Consequences? Of late runoff (3-4 wks), higher flows (50-75% increase), and reduced pH? 2011 prelim data shows no loss of diversity/abundance: resilient so far
What’s next: using the data obtained and maintaining the network into the future • Sustain funding - possibly through interagency cost-sharing? • Contribute results to California Climate Change Portal, and integrate into assessment reports of US-GCRP • Apply flow and temperature recordings for the past year to validate and calibrate ungaged flow models, and use to back-cast past flow histories (use by USGS, DWR?) • Further analysis of 2011 data to evaluate reference stability and biological indicator responses to record snowfall, high runoff, reduced pH, and delayed spring onset • Further analysis of 2012 low-flow year as substitution for future hydroclimatic conditions and 2013 as repeat? • Do communities correspond to hydrographic regimes? Invite Collaboration • High elevation hydro- and thermo-graphs for model development >>rare data from headwater streams to share • Stable isotope analysis of heavy water (18O & 2H) at each site to determine groundwater contribution (mixing models)
Conservation Applications • Although there are many endemic and montane-adapted native species of aquatic inverts in the Sierra Nevada, biogeography and habitat requirements are poorly known, so surveys supply a basic biodiversity inventory • Improved understanding of natural flow and temperature regimes, and microclimate of headwater streams • Identify habitats & taxa changing most, and how these might be protected from climatic effects on hydrologic and thermal regimes > refugia & aquatic diversity management areas • Extend GIS analysis of environmental resistance factors to assess habitat sensitivity to climate risk • Use ecological trait analysis to assess biotic vulnerability • Develop management framework to prioritize stream types for building resilience and protection of most vulnerable watersheds(riparian & meadow restoration, protect groundwater infiltration paths, reduce soil loss/debris flows by managing grazing, logging & road disturbance) • USFS-NPS adaptive planning in climate change stewardship
conclusions • Network is up and running and the biological indicators provide a strong foundation for detecting change (biodiversity & trait sensitivities to hydro-climate change) • North–South stream groups show distinct differences in snowmelt vs groundwater influence on hydrology (and related water chemistry) and in biological communities • Biological richness of northern streams is ecological “insurance”, but this also means more to lose in a region with the most severe climate risk predicted • Though having less biodiversity, southern streams harbor some vulnerable taxa with restricted distributions • Intermittent drying poses a clear risk to sustaining biodiversity, esp. in snowmelt-dominated streams, but groundwater systems appear to be more buffered (confirming a predicted climate risk-resistance) • Lower pH and high & delayed flows of 2011 do not appear to alter invertebrate communities under this change, but what about 2012-13 drought years?