Download
1 / 68
680 likes | 820 Views
Analysis and Prediction of Convective Initiation on 24 May, 2002. June 14, 2004 Toulouse 2 nd IHOP_2002 Science Meeting. Ming Xue, William Martin and Geoffrey Stano School of Meteorology and Center for Analysis and Prediction of Storms University of Oklahoma.

E N D
Analysis and Prediction of Convective Initiation on 24 May, 2002 June 14, 2004 Toulouse 2nd IHOP_2002 Science Meeting Ming Xue, William Martin and Geoffrey Stano School of Meteorology and Center for Analysis and Prediction of Storms University of Oklahoma
Our work on May 24, 2002 CI Case • MS Thesis work of Geoffrey Stano: Multi-scale study based-on ADAS analyses including special IHOP data sets, and by examining observations directly. • High-resolution simulation study (focus of this talk) • Very large (~2000) ensemble and adjoint I.C. sensitivity study. dP/dqv sensitivity fields.
Objectives • Understand convective initiation in this case • Predict and understand the convective systems involved • Assess the sensitivity of precipitation forecast to initial conditions
Methodology • Make use of special data sets collected during IHOP • Create high-resolution gridded data to perform diagnostic analysis and for model initialization • Verify model simulations against available data • Analyze realistic high-resolution model simulations to understand CI process
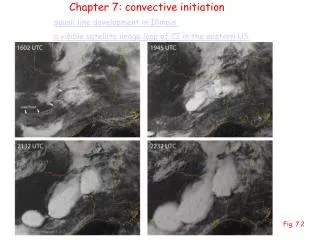
Synopsis of the Event • Convection started between 20:00 and 20:30 UTC in Texas panhandle area along a dryline. An intensive observation of IHOP_2002. • Rapidly developed into a squall line and advanced across Oklahoma and northern Texas • SPC reported almost 100 incidents of large hail, 15 wind reports, and two tornadoes in central Texas
Isotach Analysis: 250mb 19 UTC 20 UTC TX Panhandle located at left-rear of upper level jet A short wave trough moved over western TX
CIN and CAPE Analyses CIN 19UTC CIN 20UTC CAPE 20UTC CAPE 19UTC
Results of Stano’s diagnostic study • Favorable condition pointing to initial initiation near Childress, TX • Placement of 250mb jet max and minimum • Surface heating and high surface dew points • Low Convective Inhibition values • Causes for initiation • Weakening of cap over the boundary layer by turbulently mixing • Break down of cap led to higher CAPE values • Convergence along the dryline or possibly from the cold front approaching dryline • More specifics limited by data resolutions
Model Simulation Study • Model can provide much more complete data in both space and time • Easier to examine cause and effect • Model fields are dynamically consistent • Caution - model solution may deviate from truth therefore verification against truth is necessary
Model Configurations • 1 km grid nested inside 3 km one • ADAS analyses for ICs and 3 km BCs • NCEP ETA 18UTC and 00UTC analyses and 21UTC forecast used as analysis background • ARPS model with full physics, including ice microphysics + soil model + PBL and SGS turbulence • LBCs every 3h for 3km grid and every 15min for 1 km grid • 6 hour simulation/forecast, starting at 18 UTC
OBS Used by ADAS • ARM • COAG • IHOP Composite Upper Air - rawinsondes • KS Ground Water District 5 • OK Mesonet • SAO • SW Kansas Mesonet • Western TX Mesonet • Profiler data absent
T=2.5h 20:30UTC
T=3.0h 21:00UTC
T=3.5h 21:30UTC
T=4.0h 22:00UTC
T=4.5h 22:30UTC
T=5h 23:00Z T=5h 23:00Z
T=5.5h 23:30Z T=5h 23:00Z
Animations • Surface reflectivity • 2km level w, winds See movies (18:30 UTC – 00:00 UTC)
Vertical cross-section animations • w and q • w and qv • qv and qe See Movies