Download
1 / 6
60 likes | 189 Views
A Classification Data Set for PLM. Information Theory of Learning Sep. 15, 2005. Introduction to Data (1). Handwritten digits (0 ~ 9) From 32x32 bitmaps, non-overlapping 4x4 blocks are extracted. Introduction to Data (2). # of on pixels are counted in each block. (Range: 0 ~ 16)

E N D
A Classification Data Set for PLM Information Theory of Learning Sep. 15, 2005 (c) 2000-2005 SNU CSE Biointelligence Lab, http://bi.snu.ac.kr
Introduction to Data (1) • Handwritten digits (0 ~ 9) • From 32x32 bitmaps, non-overlapping 4x4 blocks are extracted. (c) 2000-2005 SNU CSE Biointelligence Lab, http://bi.snu.ac.kr
Introduction to Data (2) • # of on pixels are counted in each block. (Range: 0 ~ 16) • If # > 1, otherwise 0 • Original 32x32 bitmap is reduced to 8x8 binary matrix. (c) 2000-2005 SNU CSE Biointelligence Lab, http://bi.snu.ac.kr
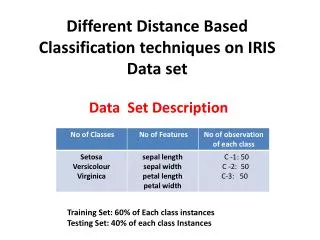
Introduction to Data (3) • Data • train.txt: 3823 examples • test.txt: 1797 examples • Representation • In the text files, each row consists of 64 binary values with its label attached at 65-th column. • Class distribution (c) 2000-2005 SNU CSE Biointelligence Lab, http://bi.snu.ac.kr
(c) 2000-2005 SNU CSE Biointelligence Lab, http://bi.snu.ac.kr
Preliminary Result • k-nn result (k = 3) on the test set • Accuray: 93.10% (ratio of correctly classified) a b c d e f g h i j <-- classified as 174 0 0 0 1 1 2 0 0 0 | a = 0 0 178 1 0 1 0 2 0 0 0 | b = 1 0 9 167 0 0 0 0 1 0 0 | c = 2 1 2 0 174 0 1 0 1 2 2 | d = 3 0 11 0 0 168 0 0 0 0 2 | e = 4 0 2 0 1 1 172 1 0 0 5 | f = 5 2 1 0 0 0 1 176 0 1 0 | g = 6 0 0 1 0 1 0 0 174 1 2 | h = 7 1 16 4 7 1 6 2 1 132 4 | i = 8 2 2 0 10 0 4 0 1 3 158 | j = 9 (c) 2000-2005 SNU CSE Biointelligence Lab, http://bi.snu.ac.kr