Download
1 / 2
20 likes | 131 Views
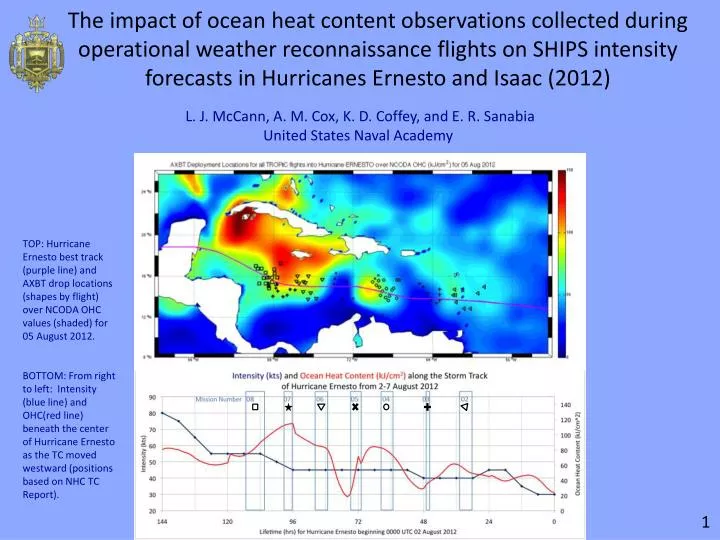
The impact of ocean heat content observations collected during operational weather reconnaissance flights on SHIPS intensity forecasts in Hurricanes Ernesto and Isaac (2012). L. J. McCann, A. M. Cox, K. D. Coffey, and E. R. Sanabia United States Naval Academy .

E N D
The impact of ocean heat content observations collected during operational weather reconnaissance flights on SHIPS intensity forecasts in Hurricanes Ernesto and Isaac (2012) L. J. McCann, A. M. Cox, K. D. Coffey, and E. R. Sanabia United States Naval Academy TOP: Hurricane Ernesto best track (purple line) and AXBT drop locations (shapes by flight) over NCODA OHC values (shaded) for 05 August 2012. BOTTOM: From right to left: Intensity (blue line) and OHC(red line) beneath the center of Hurricane Ernesto as the TC moved westward (positions based on NHC TC Report). 1
The impact of ocean heat content observations collected during operational weather reconnaissance flights on SHIPS intensity forecasts in Hurricanes Ernesto and Isaac (2012) L. J. McCann, A. M. Cox, K. D. Coffey, and E. R. Sanabia United States Naval Academy TOP: Hurricane Ernesto intensity (kt) based on the operational SHIPS model forecast initialized at 0000 UTC 06 August 2012 (solid black line); the intensity uncertainty range outlined by the maximum and minimum IA differences (dashed blue lines) realized by including AXBT (observed) OHC values in the SHIPS analysis, and the actual intensities denoted in the NHC Best Track (red line). The official forecast is denoted in green. BOTTOM: From right to left: Intensity (blue line) and OHC (red line) beneath the center of Hurricane Ernesto as the TC moved westward (positions based on NHC TC Report). Error bars indicate the range of differences between observed and model OHC values by flight. 2 06 AUG 12