Download
1 / 20
200 likes | 343 Views
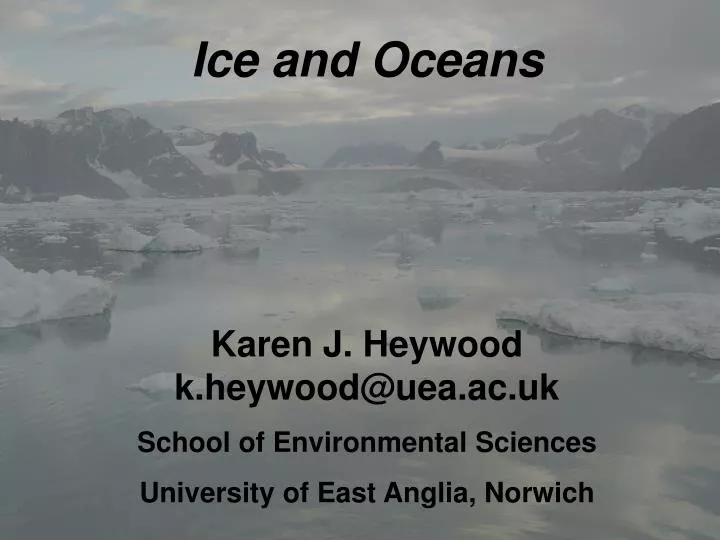
Ice and Oceans Karen J. Heywood k.heywood@uea.ac.uk School of Environmental Sciences University of East Anglia, Norwich. How can we collect sea water for scientific analysis from an inaccessible place? It may be too dangerous to get there?.

E N D
Ice and Oceans Karen J. Heywood k.heywood@uea.ac.uk School of Environmental Sciences University of East Anglia, Norwich
How can we collect sea water for scientific analysis from an inaccessible place? It may be too dangerous to get there? For example, close to an erupting submarine volcano.
Or close to the edge of a glacier, where an iceberg might calve at any time.
It may be too expensive. For example, to sample under a floating Antarctic Ice Shelf, you would have to drill a hole through hundred of metres of ice.
The solution: take Autosub, and fit it with a novel autonomous sampling device, called Aqualab. Send it out where no man (or woman) has gone before…
Installation of Aqualab water sampler in nose of Autosub Aqualab collects up to forty-nine water samples in sealed plastic bags. A 200 ml sample takes 11 minutes to collect.
Why might we want to collect water anyway? Interdisciplinary science often requires analysis of the water itself, or what is in the water. Our biological colleagues used Autosub’s camera to image life on the sea bed. What food is available in the water to support these animals?
Water samples were collected using Aqualab during Autosub missions so that we could measure the ratio of the oxygen isotopes in the sea water, 18O. We also measured how salty the water was (called salinity). Isotopes have the same number of protons in the nucleus but different numbers of neutrons. Heavy isotopes have more neutrons than light ones.
18O is the ratio of H218O to H216O, relative to Vienna Standard Mean Ocean Water (VSMOW). Brine rejection during sea ice freezing and freshwater release during melting have negligible effect on 18O but considerable effect on salinity. Freshwater input from precipitation is depleted in 18O at high latitudes, as the heavier H218O rains out first as water vapour moves polewards.
High latitude water from precipitation (glacial ice melt, rivers) is isotopically light (18O ~ -21 ‰) and fresh (S = 0). Sea ice melt is isotopically heavy (18O ~ 2 ‰) and fresh (S ~3). Oceanic water is isotopically heavy (18O ~ 0 ‰) and saline (S ~ 34.9). Therefore if we measure both 18O and salinity, we can determine the source of freshwater. We measured how much of the fresh water came from the Ice Cap (originally on land), and how much came from melted sea ice (originally in the sea).
During Autosub missions, the ship is very busy! JR106S August -September 2004 Kangerdlugssuaq fjord, East Greenland
Water samples were collected from the bottles on the CTD rosette package and from the Autosub Aqualab for subsequent 18O analysis. Autosub also continuously measures temperature and salinity of the water. Autosub potential temperature Autosub salinity
Transmittance of light beams through water indicates clarity of water and is often primarily influenced by biological activity. Large volumes of water were filtered. This showed that close to a glacier or ice shelf, the clarity of the water is influenced by sediment carried from the land by the ice.
18OOxygen isotope from CTD water samples 18Ofrom Autosub Aqualab water samples
The results show that the water in the fjord is primarily a mixture of salty ocean water, and fresh water melting into the fjord from the Greenland Ice Cap. This means that we can calculate the amount of ice sheet meltwater coming out of the fjord into the Nordic Seas.
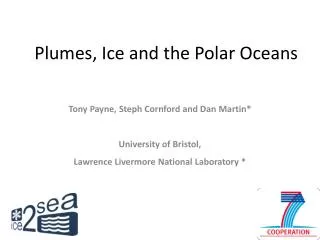
Satellite image of the Fimbulisen, Antarctica, February 2005, during Autosub Under Ice cruise. Water column thickness, Autosub under ice mission in red, ship based sections in white.
Temperature along the front of the ice shelf, showing very cold water escaping from the cavity.
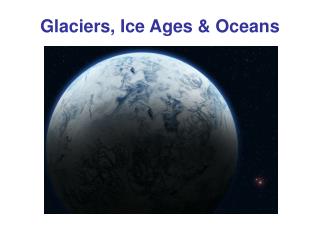
Change in ocean surface temperature 5-10 years after a catastrophic melt of the Antarctic Ice Sheet.
The results from the Autosub Under Ice programme will help us to estimate the amount of fresh water melting from the Greenland and Antarctic Ice Sheets. That means that our climate models will simulate future change more realistically.
With thanks to: all involved with AUI for their hard work and enthusiasm Autosub Under Ice programme for funding