Download
1 / 1

E N D
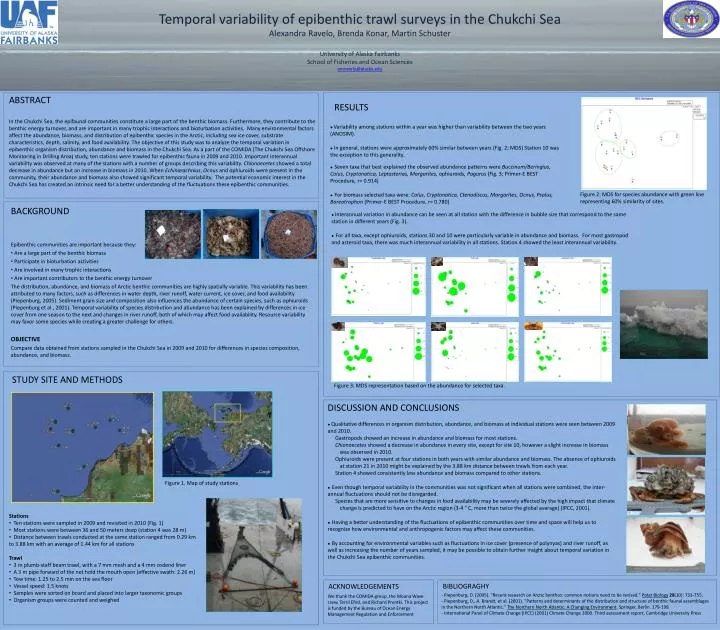
ABSTRACT In the Chukchi Sea, the epifaunal communities constitute a large part of the benthic biomass. Furthermore, they contribute to the benthic energy turnover, and are important in many trophic interactions and bioturbation activities. Many environmental factors affect the abundance, biomass, and distribution of epibenthic species in the Arctic, including sea ice cover, substrate characteristics, depth, salinity, and food availability. The objective of this study was to analyze the temporal variation in epibenthic organism distribution, abundance and biomass in the Chukchi Sea. As a part of the COMIDA (The Chukchi Sea Offshore Monitoring in Drilling Area) study, ten stations were trawled for epibenthic fauna in 2009 and 2010. Important interannual variability was observed at many of the stations with a number of groups describing this variability. Chionoecetes showed a total decrease in abundance but an increase in biomass in 2010. When Echinarachnius, Ocnus and ophiuroids were present in the community, their abundance and biomass also showed significant temporal variability. The potential economic interest in the Chukchi Sea has created an intrinsic need for a better understanding of the fluctuations these epibenthic communities. RESULTS ● Variability among stations within a year was higher than variability between the two years (ANOSIM). ● In general, stations were approximately 60% similar between years (Fig. 2; MDS) Station 10 was the exception to this generality. ●Seven taxa that best explained the observed abundance patterns were Buccinum/Beringius, Colus, Cryptonatica, Leptasterias, Margarites, ophiuroids, Pagurus (Fig. 3; Primer-E BEST Procedure, r= 0.914) ●For biomass selected taxa were: Colus, Cryptonatica, Ctenodiscus, Margarites, Ocnus, Psolus, Boreotrophon(Primer-E BEST Procedure, r= 0.780) Figure 2: MDS for species abundance with green line representing 60% similarity of sites. Temporal variability of epibenthic trawl surveys in the Chukchi SeaAlexandra Ravelo, Brenda Konar, Martin Schuster University of Alaska FairbanksSchool of Fisheries and Ocean Sciencesamravelo@alaska.edu ● Interannual variation in abundance can be seen at all station with the difference in bubble size that correspond to the same station in different years (Fig. 3). ●For all taxa, except ophiuroids, stations 30 and 10 were particularly variable in abundance and biomass. For most gastropod and asteroid taxa, there was much interannual variability in all stations. Station 4 showed the least interannual variability. BACKGROUND Epibenthic communities are important because they: Are a large part of the benthic biomass Participate in bioturbation activities Are involved in many trophic interactions Are important contributors to the benthic energy turnover The distribution, abundance, and biomass of Arctic benthic communities are highly spatially variable. This variability has been attributed to many factors, such as differences in water depth, river runoff, water current, ice cover, and food availability (Piepenburg, 2005). Sediment grain size and composition also influences the abundance of certain species, such as ophiuroids (Piepenburg et al., 2001). Temporal variability of species distribution and abundance has been explained by differences in ice cover from one season to the next and changes in river runoff, both of which may affect food availability. Resource variability may favor some species while creating a greater challenge for others. OBJECTIVE Compare data obtained from stations sampled in the Chukchi Sea in 2009 and 2010 for differences in species composition, abundance, and biomass. STUDY SITE AND METHODS Figure 3: MDS representation based on the abundance for selected taxa. • DISCUSSION AND CONCLUSIONS • ● Qualitative differences in organism distribution, abundance, and biomass at individual stations were seen between 2009 and 2010. • Gastropods showed an increase in abundance and biomass for most stations. • Chionoecetes showed a decrease in abundance in every site, except for site 10, however a slight increase in biomass was observed in 2010. • Ophiuroids were present at four stations in both years with similar abundance and biomass. The absence of ophiuroids at station 21 in 2010 might be explained by the 3.88 km distance between trawls from each year. • Station 4 showed consistently less abundance and biomass compared to other stations. • ●Even though temporal variability in the communities was not significant when all stations were combined, the inter-annual fluctuations should not be disregarded. • Species that are more sensitive to changes in food availability may be severely affected by the high impact that climate change is predicted to have on the Arctic region (3-4 ° C, more than twice the global average) (IPCC, 2001). • ●Having a better understanding of the fluctuations of epibenthic communities over time and space will help us to recognize how environmental and anthropogenic factors may affect these communities. • ●By accounting for environmental variables such as fluctuations in ice cover (presence of polynyas) and river runoff, as well as increasing the number of years sampled, it may be possible to obtain further insight about temporal variation in the Chukchi Sea epibenthic communities. Figure 1. Map of study stations • Stations • Ten stations were sampled in 2009 and revisited in 2010 (Fig. 1) • Most stations were between 36 and 50 meters deep (station 4 was 28 m) • Distance between trawls conducted at the same station ranged from 0.29 km to 3.88 km with an average of 1.44 km for all stations • Trawl • 3 m plumb-staff beam trawl, with a 7 mm mesh and a 4 mm codend liner • A 3 m pipe forward of the net hold the mouth open (effective swath: 2.26 m) • Tow time: 1.25 to 2.5 min on the sea floor • Vessel speed: 1.5 knots • Samples were sorted on board and placed into larger taxonomic groups • Organism groups were counted and weighed BIBLIOGRAGHY ACKNOWLEDGEMENTS - Piepenburg, D. (2005). "Recent research on Arctic benthos: common notions need to be revised." Polar Biology28(10): 733-755. - Piepenburg, D., A. Brandt, et al. (2001). "Patterns and determinants of the distribution and structure of benthic faunal assemblages in the Northern North Atlantic." The Northern North Atlantic: A Changing Environment. Springer, Berlin. 179-198 - International Panel of Climate Change (IPCC) (2001) Climate Change 2000. Third assessment report, Cambridge University Press We thank the COMIDA group, the Moana Wave crew, Terril Efird, and Richard Prentki. This project is funded by the Bureau of Ocean Energy Management Regulation and Enforcement