Download
1 / 1
10 likes | 149 Views
2008 Beltwide Cotton Conferences. Grower Perceptions from Illinois, Indiana, Iowa, Mississippi, Nebraska, and North Carolina on Tillage Practices with Roundup Ready Cropping Systems.

E N D
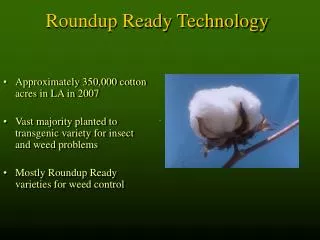
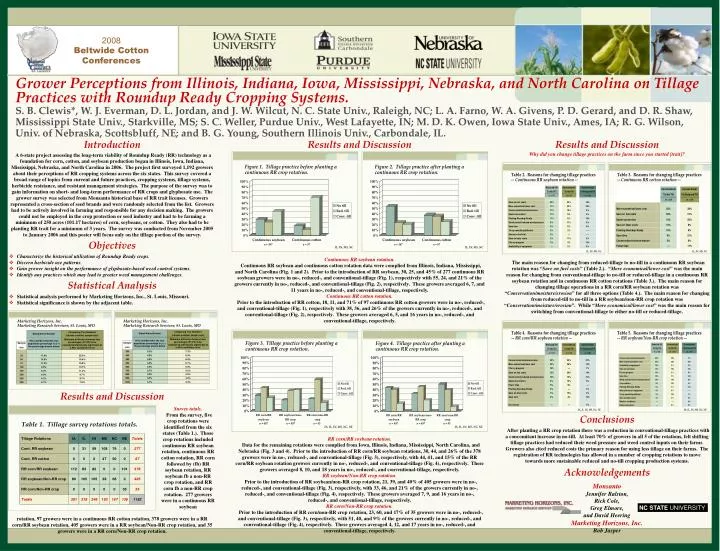
2008 Beltwide Cotton Conferences Grower Perceptions from Illinois, Indiana, Iowa, Mississippi, Nebraska, and North Carolina on Tillage Practices with Roundup Ready Cropping Systems. S. B. Clewis*, W. J. Everman, D. L. Jordan, and J. W. Wilcut, N. C. State Univ., Raleigh, NC; L. A. Farno, W. A. Givens, P. D. Gerard, and D. R. Shaw, Mississippi State Univ., Starkville, MS; S. C. Weller, Purdue Univ., West Lafayette, IN; M. D. K. Owen, Iowa State Univ., Ames, IA; R. G. Wilson, Univ. of Nebraska, Scottsbluff, NE; and B. G. Young, Southern Illinois Univ., Carbondale, IL. Introduction Results and Discussion Results and Discussion Why did you change tillage practices on the farm since you started [trait]? A 6-state project assessing the long-term viability of Roundup Ready (RR) technology as a foundation for corn, cotton, and soybean production began in Illinois, Iowa, Indiana, Mississippi, Nebraska, and North Carolina in 2006. The project first surveyed 1,192 growers about their perceptions of RR cropping systems across the six states. This survey covered a broad range of topics from current and future practices, cropping systems, tillage systems, herbicide resistance, and resistant management strategies. The purpose of the survey was to gain information on short- and long-term performance of RR crops and glyphosate use. The grower survey was selected from Monsanto historical base of RR trait licenses. Growers represented a cross-section of seed brands and were randomly selected from the list. Growers had to be actively involved in farming and responsible for any decision making. The growers could not be employed in the crop protection or seed industry and had to be farming a minimum of 250 acres (101.17 hectares) of corn, soybeans, or cotton. They also had to be planting RR trait for a minimum of 3 years. The survey was conducted from November 2005 to January 2006 and this poster will focus only on the tillage portion of the survey. Objectives • Characterize the historical utilization of Roundup Ready crops. • Discern herbicide use patterns. • Gain grower insight on the performance of glyphosate-based weed control systems. • Identify any practices which may lead to greater weed management challenges. Continuous RR soybean rotation. Continuous RR soybean and continuous cotton rotation data were complied from Illinois, Indiana, Mississippi, and North Carolina (Fig. 1 and 2). Prior to the introduction of RR soybean, 30, 25, and 45% of 277 continuous RR soybean growers were in no-, reduced-, and conventional-tillage (Fig. 1), respectively with 55, 24, and 21% of the growers currently in no-, reduced-, and conventional-tillage (Fig. 2), respectively. These growers averaged 6, 7, and 11 years in no-, reduced-, and conventional-tillage, respectively. Continuous RR cotton rotation. Prior to the introduction of RR cotton, 18, 11, and 71% of 97 continuous RR cotton growers were in no-, reduced-, and conventional-tillage (Fig. 1), respectively with 38, 36, and 26% of the growers currently in no-, reduced-, and conventional-tillage (Fig. 2), respectively. These growers averaged 6, 5, and 16 years in no-, reduced-, and conventional-tillage, respectively. The main reason for changing from reduced-tillage to no-till in a continuous RR soybean rotation was “Save on fuel costs” (Table 2.). “More economical/lower cost” was the main reason for changing from conventional-tillage to no-till or reduced-tillage in a continuous RR soybean rotation and in continuous RR cotton rotations (Table 3.). The main reason for changing tillage operations in a RR corn/RR soybean rotation was “Conservation/moisture/erosion” for all three options (Table 4.).The main reason forchanging from reduced-till to no-till in a RR soybean/non-RR crop rotation was “Conservation/moisture/erosion”. While “More economical/lower cost” was the main reason for switching from conventional-tillage to either no-till or reduced-tillage. Statistical Analysis • Statistical analysis performed by Marketing Horizons, Inc., St. Louis, Missouri. • Statistical significance is shown by the adjacent table. Results and Discussion Survey totals. From the survey, five crop rotations were identified from the six states (Table 1.). Those crop rotations included continuous RR soybean rotation, continuous RR cotton rotation, RR corn followed by (fb) RR soybean rotation, RR soybean fb a non-RR crop rotation, and RR corn fb a non-RR crop rotation. 277 growers were in a continuous RR soybean Conclusions After planting a RR crop rotation there was a reduction in conventional-tillage practices with a concomitant increase in no-till. At least 70% of growers in all 5 of the rotations, felt shifting tillage practices had reduced their weed pressure and weed control inputs on their farms. Growers also cited reduced costs the primary reason for using less tillage on their farms. The registration of RR technologies has allowed in a number of cropping rotations to move towards more sustainable reduced and no-till cropping production systems. RR corn/RR soybean rotation. Data for the remaining rotations were complied from Iowa, Illinois, Indiana, Mississippi, North Carolina, and Nebraska (Fig. 3 and 4). Prior to the introduction of RR corn/RR soybean rotations, 30, 44, and 26% of the 378 growers were in no-, reduced-, and conventional-tillage (Fig. 3), respectively, with 44, 41, and 15% of the RR corn/RR soybean rotation growers currently in no-, reduced-, and conventional-tillage (Fig. 4), respectively. These growers averaged 8, 10, and 18 years in no-, reduced-, and conventional-tillage, respectively. RR soybean/Non-RR crop rotation. Prior to the introduction of RR soybean/non-RR crop rotation, 21, 39, and 40% of 405 growers were in no-, reduced-, and conventional-tillage (Fig. 3), respectively, with 33, 46, and 21% of the growers currently in no-, reduced-, and conventional-tillage (Fig. 4), respectively. These growers averaged 7, 9, and 16 years in no-, reduced-, and conventional-tillage, respectively. RR corn/Non-RR crop rotation. Prior to the introduction of RR corn/non-RR crop rotation, 23, 60, and 17% of 35 growers were in no-, reduced-, and conventional-tillage (Fig. 3), respectively, with 51, 40, and 9% of the growers currently in no-, reduced-, and conventional-tillage (Fig. 4), respectively. These growers averaged 4, 12, and 17 years in no-, reduced-, and conventional-tillage, respectively. Acknowledgements Monsanto Jennifer Ralston, Rick Cole, Greg Elmore, and David Heering Marketing Horizons, Inc. Bob Jasper NC STATEUNIVERSITY rotation, 97 growers were in a continuous RR cotton rotation, 378 growers were in a RR corn/RR soybean rotation, 405 growers were in a RR soybean/Non-RR crop rotation, and 35 growers were in a RR corn/Non-RR crop rotation.