Download
1 / 10
110 likes | 450 Views
Vehicle Suspension Explained by Bond Graph Modeling. Justin Otero ME270 CSUS MSME Program Fall 07. Topics. Objectives Vehicle Suspension Overview Bond Graph Models Results Conclusion. Objectives. Model Vehicle Suspension in CAMPG, MATLAB and SIMULINK.

E N D
Vehicle Suspension Explained by Bond Graph Modeling Justin Otero ME270 CSUS MSME Program Fall 07
Topics • Objectives • Vehicle Suspension Overview • Bond Graph Models • Results • Conclusion
Objectives • Model Vehicle Suspension in CAMPG, MATLAB and SIMULINK. • Come up with Design parameters to optimize vehicle ride quality.
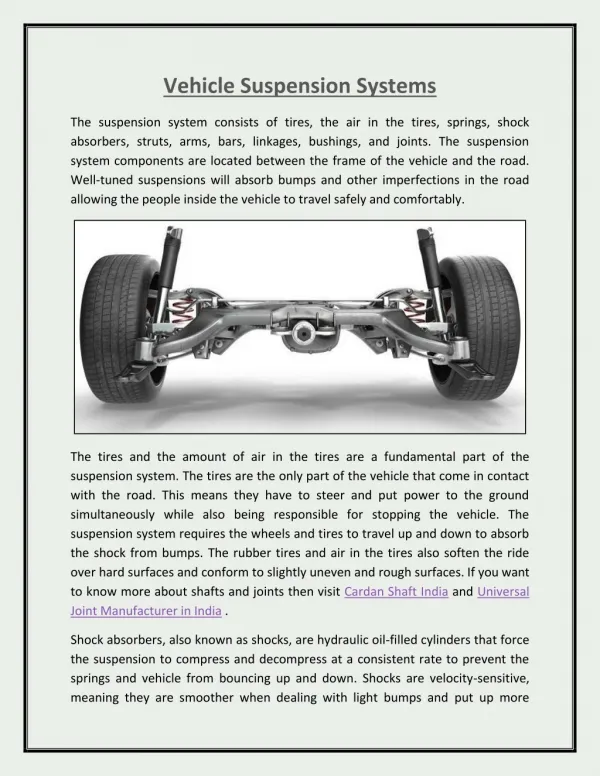
Vehicle Suspension • The suspension represents an important part of the ride quality. • Without suspension, a vehicle acts in a stiff and uncomfortable way. • Suspension system consists of a spring, a damper and the tire. • By creating a system model, a car manufacturer is able to see how the stiffness of the springs affects the ride experience.
Vehicle Suspension Typical Diagram of a Vehicle Suspension systemPicture from www.Britannica.com
Suspension Diagram Vehicle Mass, M1 Damper, b Spring, k1 Tire Center/Mass, M2 Tire w/Air, k2 Ground
Bond Graph Model I:M2 I:M1 C:1/k2 1 0 1 SF 0 SE:M2g 1 SE:M1g C:1/k1 R:b
Results • This model simulates a vehicle with a mass of 1600kg hitting a bump traveling around 12.5m/s. • Values for the design criteria:Tire spring constant, k1 = 650kN/mSuspension spring constant, k2 = 250kN/mSuspension damper constant, b = 10,000kg/s • The first graph shows how the tire compresses, then the suspension takes affect and buffers the impact. • The second graph shows how the vehicle body reacts as the suspension compresses at first, then returns to normal.
From these graphs, it’s seen that the tire compresses no more than 3cm and the total vertical distance the vehicle is displaced is no more than 10cm.
Conclusion • The bond graphs came out well with no causality issues and could be used to understand how a vehicle suspension system works. • Some other aspects could have been modeled in more detail (i.e. newer suspension systems contain sensors for traction control), and some variables (i.e. mass) were taken as estimates. • Due to time restrictions, other aspects that play a role in vehicle handling like the engine, transmission, brakes, steering and vehicle rotation had to be left out.