Download
1 / 33
330 likes | 494 Views
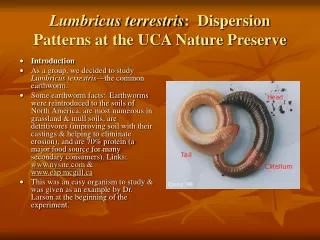
Tree Surveying at the Mequon Nature Preserve. Amy Boldt , Caitlin Finnane, Thomas Jones, Sarah Kolander , and Laura Toepfer. Outline. Introduction Background of Mequon Nature Preserve Native Trees Purpose of Study Methods Determining area of study Surveying methods Results

E N D
Tree Surveying at the Mequon Nature Preserve Amy Boldt, Caitlin Finnane, Thomas Jones, Sarah Kolander, and Laura Toepfer
Outline • Introduction • Background of Mequon Nature Preserve • Native Trees • Purpose of Study • Methods • Determining area of study • Surveying methods • Results • Species identified • Total number of trees in unit • Shannon-Wiener diversity index • Discussion of results • Recommendations for restoration
Mequon Nature Preserve: History • Founded in 2000 • First Owners • 1836: Land put up for sale from U.S. Gov./Native American Treaty • 1839: the first section of land was sold ($1.25 per acre) • Distributed to various farmers • Nature Preserve • 2003: first 356 acres purchased • 2006: increased to 436 acres
First Goal of MNP: Purchase all of Section 33 Figure 1: Section 33 of the Mequon Nature Preserve in Ozaukee County, Wisconsin, which was surveyed in September through November of 2013 (Mequon Nature Preserve 2010).
Mequon Nature Preserve: Today • Consists of woodlands, grasslands, ponds, and farmland • Funding: Paddock Fund donations, City of Mequon, and Stewardship grants from the WDNR • 438 acres • 5 miles of trails • Observation tower • Education center
Mequon Nature Preserve: Goals • Farming practices can affect "air quality, biological diversity, climate, soil condition and the quality and quantity of water“ (Wade et al. 2007) • Goals of MNP: • Restore the deciduous forest and wetlands • Promote environmental education, exploration, and stewardship Wade, Mark R; Gurr, Geoff M; Wratten, Steve D. 2007. Ecological restoration of farmland: progress and prospects. Philosophical Transactions of the Royal Society of Biological Sciences. 831-847. Available: http://www.ncbi.nlm.nih.gov/pmc/articles/PMC2610112/#!po=22.7273. (December 2013).
Common Native Tree Species at the Mequon Nature Preserve • Green ash • Mildly drought tolerant • Emerald Ash Borer • Paper crop • Aspen • 117% removal/growth rate (more trees are harvested than planted) (WDNR 2012) • Short life span • Oak • Mesic Wisconsin Department of Natural Resources. 2012. Aspen. Available: http://dnr.wi.gov/topic/Forest Businesses/documents/AspenReport.pdf. (October 2013).
Purpose of Study • To collect data of tree saplings from three restoration units • Count and Identify • Help the Mequon Nature Preserve • See if their restoration goal is on pace • If not, gives them an opportunity to see how to get back on track • Provide quantitative data for education and future grants
Units Surveyed • Three restoration units: • 2, 2A, 2B • Area of each determined by measuring side lengths • Transect lines based on areas • Equidistant from each other Figure 2: Restoration Units for Tree Surveying. Surveying took place in September through November of 2013 at the Mequon Nature Preserve in Ozaukee County, Wisconsin. Areas surveyed include units 2, 2A, and 2B as outlined in the map above (Mequon Nature Preserve 2010).
Surveying Methods • Surveyors in groups of 3 to 5 • 1 surveyor walked center of transect line • 2 surveyors 1.5m to each side of center surveyor • Distance maintained using 3m string • The number and species of the trees were recorded within 1.5m and center line • Identified species using the “Woodlands” chapter of Mequon Nature Preserve’s Field Guide • Leaf shape • Simple or compound • Size and shape of teeth
Area & Transect Lines: 2A and 2B • 2A and 2B identical in area • Widths= 220m; Lengths= 190m • 41,800 m2 / unit • Three transect lines • Each 190 m length • Run west to east • 1,710m2 of area surveyed along transect lines in each unit • (Total Area=41,800)/(Area Surveyed=1,710) = 24.4 • Used to calculate proportional survey area in unit 2
Area & Transect Lines: Unit 2 • Divided unit into geometric shapes • Total Area= 25,200 m2 • Transect lines calculated: • 25,200/24.4= 1,032.8 m2 survey area needed • Two Transect Lines • Length of each=172.1m • Width of each = 3m • Equidistant (40 m) from each other and east and west borders Figure 3: Unit 2 of the Mequon Nature Preserve in Ozaukee County, WI. Drawn for area calculations.
Results • September through November 2013 • Total of 739 trees identified • 610 identified green ash • Calculated average density and number of trees in the unit PICTURE: Natural Resources Conservation Service. 2013. Fraxinuspennsylvanica Marshall: Green Ash. Available: http://plants.usda.gov/core/profile?symbol=FRPE. (November 2013).
Identified Tree Species Table 1: Trees identified within units 2, 2A, and 2B. Surveying took place in September through November of 2013 at the Mequon Nature Preserve in Ozaukee County, Wisconsin.
Species Distribution Figure 4: Tree species distribution between units 2, 2A, and 2B in the Mequon Nature Preserve of Ozaukee County, Wisconsin in September through November of 2013.
Total Number of Trees in Unit 2A Table 2: The densities and average densities of the species on the transects in Restoration Unit 2A of the Mequon Nature Preserve Ozaukee County, Wisconsin in September through November of 2013.
Total Number of Trees in Unit 2B Table 3: The densities and average densities of the species on the transects in Restoration Unit 2B of the Mequon Nature Preserve Ozaukee County, Wisconsin in September through November of 2013.
Total Number of Trees in Unit 2 Table 4: The densities and average densities of the species on the transects in Restoration Unit 2 of the Mequon Nature Preserve Ozaukee County, Wisconsin in September through November of 2013.
Shannon-Wiener Diversity Index Dr. M. 2009.Biodiversity Pt. 1: Richness vs. Evenness or What Kinds of Beer Are In My Refrigerator. Available: http://deepseanews.com/2009/04/biodiversity-pt-1-richness-vs-evenness-or-what-kinds-of-beer-are-in-my-refrigerator/.(April 2009).
Shannon-Wiener Diversity Index of Unit 2A Table 5:The Shannon-Wiener diversity index of Unit 2A of the Mequon Nature Preserve in September through November of 2013 was 0.275.
Shannon-Wiener Diversity Index of Unit 2B Table 6:The Shannon-Wiener diversity index of Unit 2B of the Mequon Nature Preserve in September through November of 2013 was 0.408.
Shannon-Wiener Diversity Index of Unit 2 Table 7:The Shannon-Wiener diversity index of Unit 2 of the Mequon Nature Preserve in September through November of 2013 was 1.035.
Impact of Diversity in an Ecosystem • Diversity • Total number of species in an ecosystem • Relative abundance • Essential for the survival of an ecosystem • Diversity level indicates the health of an ecosystem • Low= relatively unhealthy and unsupportive of species • High= stable and healthy
Shannon-Wiener Diversity Index • Considers the species richness as well as the species equitability or diversity (Gregory 2013) • Minimum value of H’ is 0, single species community • Larger H’ value show greater richness and evenness • H’ value of 4.6 indicates healthy species diversity (Cooper 2013) • Unit 2 H’= 1.035 • Unit 2A H’= 0.275 • Unit 2B H’= 0.408 Cooper, Sharon. 2013. Shannon-Wiener Index of Diversity. Available: http://teach.beaverton.k12.or.us/~sharon_cooper/ 0EFFCA80-004C4C31.4/ShannonWiener.pdf. (November 2013). Gregory, Michael J. 2013. Species Diversity. Available: http://faculty.clintoncc.suny.edu/faculty/michael.gregory/files/ bio%20206/206%20laboratory/species%20diversity/species_diversity.htm. (November 2013).
Soil Nutrient Composition • Nitrogen and phosphorus, affect the growth and maintenance of trees • Nitrogen cycle • Nitrate and ammonium present in soil • When tree breaks down it turns into ammonia • Processed by bacteria (Kay 2013) • Phosphorus cycle • Phospholipid bilayer, ATP, nucleic acids • Symbiotic relationship with mycorrhizae (Filippelli 2002) Filippelli, Gabriel M. 2002. The Global Phosphorus Cycle. Available: http://www.agci.org/dB/PDFs/09S2_GFilippelli_ GlobalPCycle.pdf. (November 2013) Kay, Mike. 2013. The Nitrogen Cycle and Trees. Available: http://www.watershed-alliance.com/articles/educate/ Nitrogen%20Cycle.pdf. (November 2013).
Seed Dispersal • Wind dispersal • Quaking aspen (McDonough 1979) • High relative diversity • Animal dispersal • Oaks (Steele et al. 2001) • Low relative diversity • Few large trees • Dormancy phase • Clumped Dispersal • Could be caused by student field trips • Trees follow type III survivorship curve McDonough, Walter T. 1979. Quaking Aspen: Seed Germination and Early Seedling Growth. (November 2013). Steele, Michael A; Smallwood, Peter D; Spunar, Albert; Nelsen, Elise. 2001. The Proximate Basis of the Oak Dispersal Syndrome: Detection of Seed Dormancy by Rodents. American Zoology. 41(4): 852-864. (November 2013).
Past and Present Play a Role in Restoration • Restoration units utilized for agriculture (Mequon Nature Preserve 2010) • Farming lowers spatial variation • Balance of nutrient and water content (Robertson et al. 1988) • Reduce the cost of agriculture • Protect native species that are threatened due to exploitation • Drought tolerant species Gardiner, Emile S; Dey, Daniel C; Stanturf, John A; Lockhart, Brian Roy. 2010. Approaches to Restoration of Oak Forests on Farmed Lowlands of the Mississippi River and its Tributaries. Revista Columbia Forestal. 13(2): 223-236. (December 2013). Mequon Nature Preserve. 2010. Field Guide. Mequon Nature Preserve.. (September 2013). Robertson, G Philip; Hutson, Michael A; Evans, Francis C; Tiedje, James M. 1988. Spatial Variability in a Successional Plant Community: Patterns of Nitrogen Availability. Ecology. 69(5): 1517-1524. (November 2013). Wade, Mark R; Gurr, Geoff M; Wratten, Steve D. 2007. Ecological restoration of farmland: progress and prospects. Philosophical Transactions of the Royal Society of Biological Sciences. 831-847. (December 2013).
Past and Present Play a Role in Restoration (cont’d) • Thick ground coverage • Native prairie flowers and grasses • Intraspecific and interspecific competition for resources • Weather conditions • The youth of the Mequon Nature Preserve • Trails intersected the units surveyed affecting the overall abundance of trees along transect line
Recommendations to Improve Species Diversity • Plant more trees and employ controlled burning • Promotes growth of mesic species • Decrease overstory and nonmesic species • Larger amount of data collected and analyzed • No recent tree records present for comparison • Work with Milwaukee Public Works Forestry Section (Bell and Wheeler 2006) • Establish a budge for urban forests • Recruit community members for maintenance • Careful monitoring of the MNP Bell, R; Wheeler, J. 2006. Talking trees: an urban forestry toolkit for local governments. ICLEI: Local Governments for Stability. Available: http://www.milliontreesnyc.org/downloads/pdf/talking_trees_urban_forestry_toolkit.pdf (November 2013).