Download
1 / 32
320 likes | 432 Views
Dynamic Energy Budget theory. 1 Basic Concepts 2 Standard DEB model 3 Metabolism 4 Univariate DEB models 5 Multivariate DEB models 6 Effects of compounds 7 Extensions of DEB models 8 Co-variation of par values 9 Living together 10 Evolution 11 Evaluation.

E N D
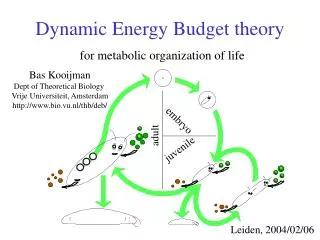
Dynamic Energy Budget theory 1 Basic Concepts 2 Standard DEB model 3 Metabolism 4 Univariate DEB models 5 Multivariate DEB models 6 Effects of compounds 7 Extensions of DEB models 8 Co-variation of par values 9 Living together 10 Evolution 11 Evaluation
Linear pathway 7.1.1 SUi SUi+1 = If all metabolites would follow the full pathway: : Product i : Intermediary metabolite i
Chain of length 1 7.1.1a Change in Unbounded fraction Steady state Unbounded fraction Production flux
Closed handshaking at all nodes 7.1.1b Change in Unbounded fractions Steady state Unbounded fractions Production fluxes
Open handshaking at all nodes 7.1.1c Change in Unbounded fractions Steady state Unbounded fractions Production fluxes
General handshaking 7.1.1d Change in Unbounded fractions Steady state Unbounded fractions Production fluxes Rejection fluxes
Trans-stage feeding strategies 7.2 Adult Anoplius viaticus collects all food (here Trochosa terricola) for the juvenile stage of the next generation; the adult feeds on nectar Juvenile mayflies (Emphemeroptera) cover all adult needs for food; Adult’s digestive system is filled with air
Food deposits 7.2.1 Melanerpes formicivorus (acorn woodpecker) stores acorns & beech-mast in crevices (upto 60000) from hundreds of km around its residence
Farming: external storage 7.2.1a The gardener-nurse caste of leafcutter ants garden fungi under ground, transplanting them onto fresh substrate and weeding out wrong species of fungus Ambrosia beetles garden fungi under tree bark, and some have special structures in their head, mycangia, to transport the fungus The social amoeba Dictyostelium carries bacteria in their multi-cellular slug-stage and inoculate fresh stubstrate with them
Fast/slow substrate uptake 7.2.2 • DEB-consistent variant of Morel 1987 • uptake depends on substrate concentration and reserve density • reserve mobilization independent of uptake Not yet tested against experimental data
Short vs long-term nutrient uptake 7.2.2a Morel 1987 on nutrient uptake in algae Variant that is consistent with DEB/Droop
Satiation-driven feeding 7.2.3 • Suppose that satiation s is a system variable which • increases instantaneously with an amount sX • upon feeding on a food particle • decays exponentially at rate kSduring starvation • Feeding occurs when a food particle arrives, while satiation s(t) < 1 • The resulting feeding rate is numerically well described by Extendable to more food types, preferences are set by type-specific satiation thresholds Doucet, 2003 The H-response: A satiation-driven functional response (not published)
Functional surface area 7.2.5 Heliozoans and foraminiferans have threat-like extensions of protoplasm on which they take up food particles functional surface area depends on feeding rate relative to ratio of moving rate and thickness of stagnant water mantle
Diffusion limitation 7.2.5b mantle thickness Uptake rate: substrate concentration saturation constants 0 distance from membrane substrate conc., - at membr max uptake rate generally:
External digestion 7.2.6 feeding strategy intracellular social Yield metab on enzyme solitary time, h metab profile t = ∞ solitary feeding social feeding conc enzyme, metab distance from cell, mm distance from cell, mm
Moving gut 7.3 Paramecium, Tetrahymena (Ciliophora) Feeding vacuoles of ciliates travel from the cell mouth to the cell anus, where the feaces is excreted. These vacuoles can be considered as a moving gut. From: Mader, S. S. 1993 Biology, WCB Sleigh, M. 1989 Protozoa, E. Arnold, London
input, output input, output input, output time time time Digestive system 7.3a completely stirred reactor stomach model • Stomach • good in buffering • residence times • exponentially distributed • many short times, few large ones • Gut • bad in buffering • residence time • constant • digestion requires some time plugflow reactor gut model both reactors in series
Mitochondria 7.6 TriCarboxylic Acid cycle Enzymes pass metabolites directly to other enzymes Enzymes catalizing transformations 5 and 7 are linked to the inner membrane (and FAD/FADH2) All enzymes are linked into a metabolon Net transformation: Acetyl CoA + 3 NAD+ + FAD + GDP 3- + Pi2- + 2 H2O = 2 CO2 + 3 NADH + FADH2 + GTP 4- + 2 H+ + HSCoA Transformations: 1 Oxaloacetate + Acetyl CoA + H2O = Citrate + HSCoA 2 Citrate = cis-Aconitrate + H2O 3 cis-Aconitrate + H2O = Isocitrate 4 Isocitrate + NAD+ = α-Ketoglutarate + CO2+ NADH + H+ 5 α-Ketoglutarate + NAD+ + HSCoA = Succinyl CoA + CO2 + NADH + H+ 6 Succinyl CoA + GDP 3- + Pi 2- + H+ = Succinate + GTP 4- + HSCoA 7 Succinate + FAD = Fumarate + FADH2 8 Fumarate + H2O = Malate 9 Malate + NAD+ = Oxaloacetate + NADH + H+
Dilemma of pathway enzymes 7.6b • Many metabolites have a dual function: • building block for synthesis of functional units • substrate to generation of energy (ATP) • or reducing power (NADH, NADPH) • Cell’s need for building blocks depends on variable growth rate • Problem: • How is cell’s need “known” by enzyme molecules of pathway? • Example of competing needs: growth versus maintenance Kooijman & Segel 2005 How growth affects the fate of cellular substrates. Bull Math Biol67: 57-77
Pathway whole cell 7.6c Fixed stoichiometries for maintenance and growth Variable overall stoichiometry Can a model for pathway kinetics give this result?
Constraints on pathway dynamics 7.6d Requirements by cell for maintenance and growth: metabolite i enzyme i rejection, production flux spec maintenance flux spec growth rate yield coefficients (fixed) reserve density ME/MV abundance of X0 in E abundance of Si in E, V Supply flux to pathway: Amount of SU i per mol of structure:
Pathways & allocation 7.6e structure structure maintenance maintenance reserve reserve structure Mixture of products & intermediary metabolites that is allocated to maintenance (or growth) has constant composition reserve maintenance Kooijman & Segel 2005
Diauxic growth 7.9.4a Adaptation to different substrates is controlled by: enzyme turnover 0.15 h-1 preference ratio 0.5 acetate cells Substrate conc., mM biomass conc., OD433 oxalate time, h Growth of acetate-adapted Pseudomonas oxalaticus OX1 data from Dijkhuizen et al 1980 SU-based DEB curves fitted by Bernd Brandt Brandt, 2002 PhD thesis VU, Amsterdam
Numerical matching for n=4 7.6f 0 4 1 3 2 2 3 Unbound fraction 4 Product flux 1 Spec growth rate 0 • = 0.73, 0.67, 0.001, 0.27 handshaking • = 0.67, 0.91, 0.96, 0.97 binding prob k = 0.12, 0.19, 0.54, 0.19 dissociation nSE = 0.032,0.032,0.032,0.032 # in reserve nSV = 0.045,0.045,0.045,0.045 # in structure yEV= 1.2 res/struct kE= 0.4 res turnover jEM = 0.02 maint flux n0E = 0.05 sub in res Rejected flux 1 2 3 Spec growth rate
Matching pathway whole cell 7.6g No exact match possible between production of products and intermediary metabolites by pathway and requirements by the cell But very close approximation is possible by tuning abundance parameters and/or binding and handshaking parameters Good approximation requires all four tuning parameters per node growth-dependent reserve abundance plays a key role in tuning Kooijman and Segel 2005
Aging in adult insects 7.8.1 survival based on observed reproduction No growth Weibull Model =3 surviving number # of eggs/beetle, d-1 initial random mort surviving number age after eclosion, d age after eclosion, d age after eclosion, d Data: Ernsting & Isaaks, 1991 Data: Rose 1984 High food, 20/10 °C 0.63 a-2 High food, 10 °C 0.547 a-2 Low food, 20/10 °C 0.374 a-2 Notiophilus biguttatus Drosophila melanogaster
Anchovy Engraulis encrasicolus 7.8.2 embryo 0.16 cm 0.22 cm length, cm 0.4 cm 0.9 cm time, d 1.2 cm >4 cm Pecquerie 2008 PhD thesis VU A’dam
max .5 max many types of carriers only carriers for glucose 70 mg/l 0.06 mg/l Adaptation 7.9.3 Glucose-limited growth of Escherichia coli “wild type” Schulze & Lipe, 1964 glucose-adapted Senn, 1989 specific growth rate, h-1 glucose, mg/l glucose, mg/l
Adaptation 7.9.4 Batch culture, Monod special case • Model elements: • uptake of substrate by specific carriers • carrier densities nA and nB • metabolic signals from uptake fini • relative signal sA = pAfAnA/ipifini • carrier production by SUs that are fed by • relative signals that inhibit reciprocally • carriers have a common turnover rate • Result: • Expression fraction 0 asymptotically • in absence of substrate spec growth rate max spec growth rate on i expression fraction for i carrier turnover rate preference ratio biomass density substrate i conc scaled func response saturation coeff for i yield of biom on substr Brandt et al, 2004 Water Research, 38, 1003 - 1013
Diauxic growth 7.9.4b Adaptation to different substrates is controlled by: enzyme turnover 0.7 h-1 preference ratio 0.8 fructose cells succinate fructose conc, mM succinate conc, mM fruc in cells biomass conc., OD590 suc in cells time, h Growth of succinate-adapted Azospirillum brasilense intracellular amounts followed with radio labels data from Mukherjee & Ghosh 1987 Brandt, 2002 PhD thesis VU, Amsterdam
Adaptation in degradation 7.9.4.c • - E. coli • - fumarate • - pyruvate • - E. coli • - fumarate • - glucose concentration, g/l concentration, g/l time, h time, h Active pyruvate carriers suppress expression of fumarate carriers Active glucose carriers don’t suppress expression of fumarate carriers Kooijman & Troost 2007 Biol Rev 82: 1-30
Dynamic Energy Budget theory 1 Basic Concepts 2 Standard DEB model 3 Metabolism 4 Univariate DEB models 5 Multivariate DEB models 6 Effects of compounds 7 Extensions of DEB models 8 Co-variation of par values 9 Living together 10 Evolution 11 Evaluation