Download
1 / 19
190 likes | 379 Views
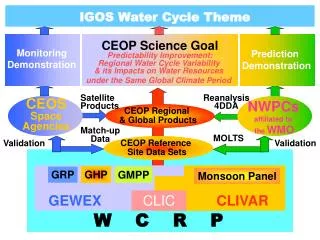
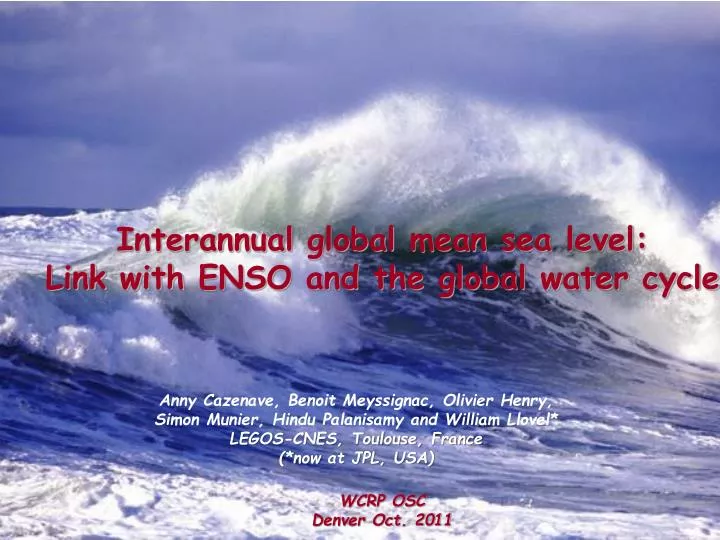
Interannual global mean sea level : Link with ENSO and the global water cycle. Anny Cazenave , Benoit Meyssignac , Olivier Henry, Simon Munier, Hindu Palanisamy and William Llovel * LEGOS-CNES, Toulouse, France (* now at JPL, USA). WCRP OSC Denver Oct. 2011. ENSO.

E N D
Interannual global meansealevel: Link with ENSO and the global water cycle AnnyCazenave, Benoit Meyssignac, Olivier Henry, Simon Munier, HinduPalanisamy and William Llovel* LEGOS-CNES, Toulouse, France (*nowat JPL, USA) WCRP OSC Denver Oct. 2011
ENSO GLOBAL WATER CYCLE Land water storage Global meansealevel(redcurve) El Nino La Nina
Present-daysealevelrise Satellite altimetry era (since 1993) Rate: 3 .3 ( +/- 0.4) mm/yr 6 cm Projections from coupled climate models IPCC, 2007 Today Historical tide gauge data (Church and White, 2006) Rate:1.7 (+/- 0.3) mm/yr ~20 cm
SeaLevel Budget: • Altimetryera (1993-2010) Sea level rate Sum of climatic components (~3 mm/yr) Observed rate of sealevelrise (3.3 mm/yr) 3 mm/yr Land ice 2 mm/yr Thermal expansion Ice sheets ~ 0.8 mm/yr 1 mm/yr Glaciers ~1 mm/yr ~1.2 mm/yr
Interannual global mean sea level (1993-2010) ENSO index Detrended global mean sea level MEI=Multivariate ENSO Index Nerem et al. (2010)
Whatis the cause of the observedcorrelation • betweeninterannual global meansealevel • and ENSO?: • Oceanheat content? • thermal expansion anomaly? • Land water storage? • ocean mass anomaly?
Water mass conservation in the climate system Global Water Cycle ∆Mocean + ∆Mland= 0 ∆M : change in water mass Atmosphericreservoirneglected
Detrended global meansealeveland total land water storage(based on the MeteoFrancehydrological model) Detrended global meansealevel Amazon basin contribution In equivalentsealevel 1997-1998 El Nino Global land water storage (expressed in equivalentsealevel ) Update of Llovel et al. (2011)’ study
Whatprocessiscausing the >0 anomalyseen in the • global meansealevelduring El Nino? • Whichocean basin isresponsible? • (is the wholeoceanconcerned or isit a localizedeffect?) El Nino More rain over oceans Lessrain over land
Area-averaging of altimetry-basedsealevel data Atlantic PACIFIC Indian Ocean
Atlantic Ocean Area-averaged sea level Thermosteric sea level « Ocean mass component » Weighting by the ratio of the averaging area to the total ocean surface
IndianOcean Area-averaged sea level Thermosteric sea level « Ocean mass component » Weighting by the ratio of the averaging area to the total ocean surface
Pacific Ocean Area-averaged sea level Thermosteric sea level 1997-1998 El Nino « Ocean mass component » Weighting by the ratio of the averaging area to the total ocean surface
North Pacific Ocean Area-averaged sea level Thermosteric sea level « Ocean mass component » Total land water (expressed in equivalent sea level) Weighting by the ratio of the averaging area to the total ocean surface
North Pacific water budget • dMnP/dt = P-E+ R oceanic water balance • P-E = -(dPwater/dt + divQ) atmospheric water balance MnP: north Pacific ocean mass P : precipitation, E : evaporation; R : runoff Pwater : precipitable water divQ : moisture flux divergence Data from ERA-Interim
Time derivative of the North Pacificocean mass and P-E Time derivative of north Pacific ocean mass P-E
1st mode of theEOF decomposition of P-E over the Pacific 1997-1998 ENSO
Conclusions • Interannual variability of the global mean sea level directly related to ENSO-driven changes in the global water cycle • The positive anomaly of the global mean sea level seen during El Nino essentially due to (tropical) north Pacific ocean mass increase • North Pacific ocean mass increase during El Nino correlates well with net precipitation (P-E) increase in that region • Positive (P-E) anomaly asymmetrical wrt equator during El Nino • But several unsolved questions remain • Why does the north Pacific alone contribute to the global mean sea level anomaly and almost perfectly balance total land water storage changes? • What are the effects of fresh water input and salinity changes in the NP? • What is the role of wind stress? • Are there circulation-driven mass redistributions? • ………