Download
1 / 24
240 likes | 325 Views
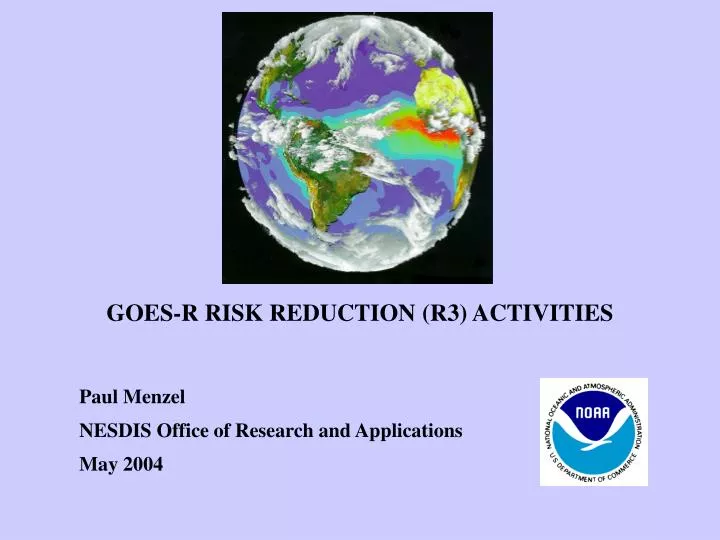
GOES-R RISK REDUCTION (R3) ACTIVITIES Paul Menzel NESDIS Office of Research and Applications May 2004. End to End GOES-R System Plan * User Requirements set forth in GOES Users Conferences (OSD, ORA) * Instrument Requirements drafted in PORD (ORA, OSD, GSFC)

E N D
GOES-R RISK REDUCTION (R3) ACTIVITIES • Paul Menzel • NESDIS Office of Research and Applications • May 2004
End to End GOES-R System Plan * User Requirements set forth in GOES Users Conferences (OSD, ORA) * Instrument Requirements drafted in PORD (ORA, OSD, GSFC) Tradeoffs between Inst Design and Science Req dialogue with vendor (OSD, ORA) Instrument Cal/Val T/V and postlaunch checkout (ORA) * Ground System /Archive Design and Implementation (OSD) * Algorithm and Product Development ATBDs (ORA) simulations (ORA) demonstration during science data gathering (ORA, JCSDA) s/w architecture studies (ORA, OSDPD) * Operations s/w implementation (OSDPD) science stewardship (ORA, NCDC) archive (NCDC) data assimilation (EMC)
End to End GOES-R System Plan (covered in GOES R3 plan) * User Requirements set forth in GOES Users Conferences (OSD, ORA) * Instrument Requirements drafted in PORD (ORA, OSD, GSFC) Tradeoffs between Inst Design and Science Req dialogue with vendor (OSD, ORA) Instrument Cal/Val T/V and postlaunch checkout (ORA) * Ground System /Archive Design and Implementation (OSD) * Algorithm and Product Development ATBDs (ORA) simulations (ORA) demonstration during science data gathering (ORA, JCSDA) s/w architecture studies (ORA, OSDPD) * Operations s/w implementation (OSDPD) science stewardship (ORA, NCDC) archive (NCDC) data assimilation (EMC)
R3 provides the necessary elements for early GOES-R utilization • capable informed users, • flexible inventive providers, • pre-existing data infrastructures, • informative interactions between providers and users, • knowledge brokers that recognize new connections between capabilities and needs, • champions of new opportunities in high positions, • well planned transitions from research demonstrations to operations, and • cost effective use of GOES-R for improved coastal ocean, weather & water, climate, and commerce applications
R3 enables efficient adoption of GOES-R data & products into NOAA Wx and Climate services within 6 months of routine operations validation of radiometric GOES-R performance unique first time ever imagery examples of improved derived products for weather and coastal ocean nowcasting case studies of NWP impact within one year operational utilization of GOES-R data and early products
Using GOES-R to help fulfill NOAA’s Mission Goals (Ecosystems, Weather/water, Climate, and Commerce) Timothy J. Schmit, W. P. Menzel, NOAA/NESDIS/ORA (Office of Research and Applications) James J. Gurka, NOAA/NESDIS/OSD (Office of Systems Development) Jun Li, Mat Gunshor, CIMSS (Cooperative Institute for Meteorological Satellite Studies) Nan D. Walker, Coastal Studies Institute, Louisiana State University GOES-R data and products will support all of NOAA’s four mission goals! GOES-R data and products will support all of NOAA’s four mission goals!
Enhanced GOES Capabilities Support NOAA Strategic Goals Weather and Water * Improved disaster mitigation with hurricane trajectory forecasts benefiting from better definition of mass and motion fields. * Improved knowledge of moisture and thermal fields provide better data for agricultural forecasting and nowcasting. * Better general weather announcements affecting public health from improved forecasting and monitoring of surface temperatures in urban and metropolitan areas during heat stress (and sub-zero conditions). Climate * Hourly high spectral resolution infrared calibrated geo-located radiances facilitate radiance calibration, calibration-monitoring, and satellite-to-satellite cross-calibration of the full operational satellite system; and provide measurements that resolve climate-relevant (diurnal, seasonal, and long-term interannual) changes in atmosphere, ocean, land and cryosphere. Ecosystems and Coastal Water * Huge increase in measurements beneficial to ecosystem management and coastal & ocean resource utilization. * First time ever, characterization of diurnal ocean color as a function of tidal conditions and observation of phytoplankton blooms (e.g. red tides) as they occur. * Improved coastal environment monitoring of a) response of marine ecosystems to short-term physical events, such as passage of storms and tidal mixing; b) biotic and abiotic material in transient surface features, such as river plumes and tidal fronts; and c) location of hazardous materials, such as oil spills, ocean waste disposal, and noxious algal blooms Commerce * Better information regarding conditions leading to fog, icing, head or tail winds, and development of severe weather including microbursts en route makes air traffic more economical and safer. Better depiction of ocean currents, low level winds and calm areas, major storms, and hurricanes (locations, intensities, and motions) benefits ocean transportation. Information regarding major ice storms, fog, flooding and flash flooding, heavy snowfall, blowing snow, and blowing sand already assists train and truck transportation. * Power consumption in the United States can be regulated more effectively with real-time assessment of regional and local insolation as well as temperatures.
Major points for R3 Plan R3 embraces all multi- & hyper -spectral experiences for GOES-R preparation AVIRIS, SHIS, NASTI, SeaWIFS, Hyperion, MODIS, AIRS, MSG, IASI, CrIS, GIFTS Time continuous hyperspectral data offer new opportunities balance of temporal, spatial, and spectral for ocean and atm observations Instrument characterization pre-launch vacuum test experience with CrIS and GIFTS important Aircraft, leo, geo-GIFTS (?), & simulated data used for science prep near polar MODIS & AIRS and ER-2 in crop duster flights important data over a variety of coastal and weather situations will be collected R3 plan covers preparations for radiances and derived products design options for ground system and archive considered (implementation resourced elsewhere) R3 plan covers FY04 through FY12 resources are distributed over 10 tasks FY06 starts full strength preparations
R3 Tasks Data processing and Archive Design (Task 0) helps with timely design and continues advisory capacity during implementation Algorithm Development (Task 1) starts with ATBDs for GIFTS CDR, learns from aircraft and leo data, & grows into prototype ops system Preparations for Data Assimilation (Task 2) starts early and expand just before launch HES Design Synergy (Task 3) continues to guide trade space between algorithms & instrument Calibration / Validation (Task 4) exploits CrIS and GIFTS TV in prep for GOES-R TV, prepares for field campaigns Data Assimilation (Task 5) big challenge is addressed early Computer System for NWP (Task 6) one time purchase plus annual maintenance Data impact tests (Task 7) many OSEs of different components of observing system Nowcasting applications development (Task 8) new products and visualizations Education and Outreach and Training (Task 9) distance learning tools & K-16 involvement
R3 addresses challenges of GOES-R data utilization • better use over land, • better use in clouds, • better use in coastal regions • exploitation of spatial & temporal gradients measured by satellite instruments • data compression techniques that don’t average out 3 sigma events (ie. retrievals versus super channels), • inter-satellite calibration consistency, • early demonstration projects before operations, • synergy with complementary observing systems (ie. GPS and leo microwave), • sustained observations of oceans & atmosphere and ultimately climate
GOES-R improved products include Imagery / Radiances Sea Surface Temperature (SST) Dust and Volcanic Ash Detection Precipitation Estimations Atmospheric Motions Hurricane Location and Intensity Biomass Burning / Smoke Fog Detection Aircraft Icing Radiation Budget Atmospheric Profiles Water Vapor Processes Cloud Properties Surface Characteristics Atmospheric Constituents Ocean Color (Ocean water-leaving radiances or reflectances) Chlorophyll concentration Suspended sediment concentration Water clarity / visibility Coastal Currents Harmful Algal Blooms Coastal Normalized Difference Vegetation Index (NDVI) Erosion and Bathymetric Changes
Three Functions HES, ABI, and CWI
GOES-R HES temporal (15 min), spectral (0.5 cm-1), spatial (1-10 km), & radiometric (0.1 K) capabilities will * depict water vapor as never before by identifying small scale features of moisture vertically and horizontally in the atmosphere * track atmospheric motions much better by discriminating more levels of motion and assigning heights more accurately * characterize life cycle of clouds (cradle to grave) and distinguish between ice and water cloud ( very useful for aircraft routing) and identify cloud particle sizes (useful for radiative effects of clouds) * measure surface temperatures (land and sea) by accounting for emissivity effects (improved SSTs useful for sea level altimetry applications) * distinguish atmospheric constituents with improved certainty; these include volcanic ash (useful for aircraft routing), ozone, and possibly methane plus others trace gases.
HES’ HES
Atmospheric transmittance in H2O sensitive region of spectrum Studying spectral sensitivity with AIRS Data AIRS BT[1386.11] – BT[1386.66] Spectral change of 0.5 cm-1 causes BT changes > 10 C
Twisted Ribbon formed by CO2 spectrum: Tropopause inversion causes On-line & off-line patterns to cross 15 m CO2 Spectrum Blue between-line Tbwarmer for tropospheric channels,colder for stratospheric channels --tropopause-- Signature not available at low resolution
Best products will be realized from combinations of ABI and HES (Hyperspectral Environmental Suite) data (IR and Visible/near IR on the HES-Costal Water)! Better cloud clearing, better spatial, etc ABI HES Better surface emissivity, better spectral, etc
ABI Bands Based on experience from: MSG/AVHRR/Sounder(s) MODIS/MTG/ Aircraft, etc Current GOES Imagers
GOES-R Coastal Water Imaging Function • GOES-R provides first ocean color capability from geo orbit • Can make measurements in constant tidal conditions • GOES-R enables more frequent views of U.S. coastal ocean color – Routine coverage of U.S. East Coast every 3 hours, with 1 hour refresh for high priority areas • GOES-R provides more opportunities for cloud-free viewing • Better detect/monitor/track rapidly changing phenomena such as Harmful Algal Blooms, sediment plumes, and chaotic coastal zone currents magnitude that could be underestimated due to diurnal behavior • GOES-R coastal water imaging function offers higher spatial resolution (~300 meters) • Fisheries researchers are limited by spatial resolution of current systems—better than 1 km needed to improve measurement and modeling of small scale phenomena such as migration pathways for salmon fisheries
GOES-R resolves more details Current GOES Visible Image Turbidity Haze Atoll Waters MODIS examples from SSEC Direct Broadcast
GOES-R will help find answers to the following basic science questions. Can weather forecast duration and reliability be improved by new remote sensing, data assimilation, and modeling? How are global precipitation, evaporation, and the cycling of water changing? What are the effects of clouds and surface hydrologic processes on weather and forecasting as well as climate? Can satellite data contributions improve seasonal to inter-annual forecasts? Can satellite data contributions help to detect long-term change (decadal tocentennial time span)? How are the oceanic ecosystems (open and coastal) changing? What portions are natural versus anthropogenic?