Download
1 / 50
510 likes | 652 Views
Bolometric Interferometry: the best technique for a CMB B-modes polarization satellite???. Lucio Piccirillo Cardiff University Astronomical Instrumentation Group ESTEC June 20 th , 2003. Gravity wave effects. Universe is 13.7 billion years old with a margin of error of close to 1%.

E N D
Bolometric Interferometry: the best technique for a CMB B-modes polarization satellite??? Lucio Piccirillo Cardiff University Astronomical Instrumentation Group ESTEC June 20th, 2003
Universe is 13.7 billion years old with a margin of error of close to 1%. • First stars ignited 200 million years after the Big Bang. • Light in WMAP picture from 380,000 years after the Big Bang. • Content of the Universe: • 4% Atoms, 23% Cold Dark Matter, 73% Dark energy. • The data places new constraints on the dark energy. It seems more like a "cosmological constant" than a negative-pressure energy field called "quintessence". But quintessence is not ruled out. • Fast moving neutrinos do not play any major role in the evolution of structure in the universe. They would have prevented the early clumping of gas in the universe, delaying the emergence of the first stars, in conflict with the new WMAP data. • Expansion rate (Hubble constant) value: Ho= 71 km/sec/Mpc (with a margin of error of about 5%) • New evidence for Inflation (in polarized signal) • For the theory that fits the data, the Universe will expand forever. (The nature of the dark energy is still a mystery. If it changes with time, or if other unknown and unexpected things happen in the universe, this conclusion could change.)
Frame one depicts temperature fluctuations (shown as color differences) in the oldest light in the universe, as seen today by WMAP. Temperature fluctuations correspond to slight clumping of material in the infant Universe, which ultimately led to the vast structures of galaxies we see today. Frame two shows matter condensing as gravity pulls matter from regions of lower density to regions of higher density. Frame three captures the era of the first stars, 200 million years after the Big Bang. Gas has condensed and heated up to temperatures high enough to initiate nuclear fusion, the engine of the stars. Frame four shows more stars turning on. Galaxies form along those filaments first seen in frame two, a web of structure. Frame five depicts the modern era, billions upon billions of stars and galaxies... all from the seeds planted in the infant Universe.
Why study the polarization of the CMB? • It is generated by local quadrupole Thomson scattering at the last scattering surface. • CMB holds imprints in its pattern that potentially can reveal the physics of the inflationary epoch • provide a new handle on the dark matter and energy in the Universe • breaks the degeneracy on some cosmological parameters • it gives info about the epoch of reionization • tensor field. It triples the number of observables: from <TT>, to <TE>,<EE> and <BB> • <BB> power spectrum could be the ONLY way to detect the effects of the primordial long-wavelength stochastic gravitational wave background.
Connecting Quarks with the Cosmos: Eleven Science Questions for the New Century The report released on 4/17/2002 by Committee on the Physics of the Universe (CPU) Board on Physics and Astronomy (BPA) National Research Council (NRC), U.S.A.
The 11 Science Questions for the New Century • What is the dark matter? • What is the nature of the dark energy? • How did the universe begin? • Did Einstein have the last word on gravity? • What are the masses of the neutrinos, andhow have they shaped the evolution of theuniverse? • How do cosmic accelerators work and whatare they accelerating? • Are protons unstable? • Are there new states of matter at exceedinglyhigh density and temperature? • Are there additional spacetime dimensions? • How were the elements from iron to uraniummade? • Is a new theory of matter and light needed atthe highest energies?
The 7 CPU / BAP’s Recommendations • Recommendation No. 1 • Measure the polarization of the cosmicmicrowave background with the goal ofdetecting the signature of inflation.TheCommittee recommends that NASA, NSF,and DOE undertake research anddevelopment to bring the needed experimentsto fruition. • Recommendation No. 2 • Determine the properties of the darkenergy.The Committee supports the LargeSynoptic Survey Telescope project, which hassignificant promise for shedding light on thedark energy. • Recommendation No. 3 • Determine the neutrino masses, theconstituents of the dark matter and thelifetime of the proton.TheCommitteerecommends that DOE and NSF work togetherto plan for and to fund a new generation ofexperiments to achieve these goals.
Recommendations No. 4 Use space to probe the basic laws ofphysics.The Committee supports theConstellation-X and Laser Interferometer SpaceAntenna missions Recommendation No. 5 Determine the origin of the highest energygamma rays, neutrinos and cosmic rays. Recommendations No. 6 Discern the physical principles that governextreme astrophysical environments throughthe laboratory study of high-energy-densityphysics. Recommendation No. 7 Realize the scientific opportunities at theintersection of physics and astronomy.
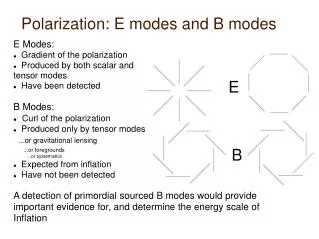
Stokes parameters Fully characterise an e.m. field. Only linear polarization is predicted in the CMB. Ex Ey Stokes parameters are local. More convenient to define E and B decompositions (global) in terms of linear combinations of U and Q, in complete analogy with e.m. fields. Both rotationally invariant, E transforms like a scalar while B transform like a pseudo-scalar. Scalar perturbations, responsible for the acoustic peaks in the <TT> cannot generate (first order) B-modes signal. The B-mode component may contain the signature of tensor perturbations (gravity waves) produced during the inflationary epoch. Its detection gives us a glimpse of the Universe at 10-38 seconds after the big-bang!!!!
The spatial power spectra of CMB temperature anisotropies (black), grad polarization (red), and curl polarization due to the GWB (blue) and due to the lensing of the grad mode (green), all assuming a standard CDM model with T/S = 0.28. The dashed curve indicates the effects of reionization on the grad mode for tau = 0.1. All-sky map/ satellite better suited to measure this bump
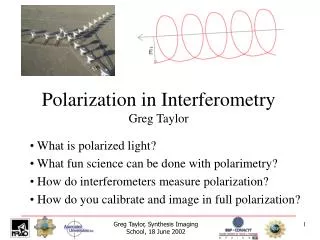
Why bolometric interferometry? (and what is it?) Interferometry (heterodyne) • In general we have i=1,...,n single dishes (often/always? with a single receiver) • Telescopes of diameter D spaced with baselines Bij • Form n(n-1)/2 baselines each requiring a correlator to recover the visibility phase shift Complex visibility complex correlator horns amplifiers
adding interferometers using passive correlators and direct detectors: phase shift Complex visibility + horns direct detector beam combiner phase shift Complex visibility complex correlator horns amplifiers heterodynebolometric amplifier/mixer (low noise elem.) nothing digital/analog correlator beam combiner (passive) diodes direct detectors (low noise elem.) Michelson and Fizeau, followed by COAST in Cambridge, pioneered these ideas
What signal do we expect to see at the detector? recovered with spatial or temporal chopping
Two ways of doing adding interferometry: • Pupil-plane (Michelson) (temporal display of fringes) • Image-Plane (Fizeau) (spatial display of fringes) B-modes: large scale CMB polarization small scale CMB polarization
Pupil plane interferometry (fringes are temporally displayed) Method of combining the two beams using polarizers (or half-silvered mirrors) and then focusing on a single pixel detector. Also called Michelson interferometer. Beam splitter has the property that the phase difference between transmitted and reflected beam is exactly 90 degrees. That’s why the +/- Dz(t) – variable delay
Image plane combination (fringes are spatially displayed) Method of combining the two beams in which each beam is focused to make an image of the sky. The images are superposed and interference fringes will form across the image. Also called Fizeau interferometer. A phase difference (Dz) is artificially introduced to compensate for optical delays into the system or to modulate the signal into your detector B B0 V is the visibility
How to recover the visibilities: • Each telescope/optical element has its own phase switcher • Each phase switcher is modulated at a different audio-frequency Fi bigger than 1/ of the direct detector • All the n(n-1)/2 beating frequencies Bij= Fi-Fj are within the electrical bandwidth of the detectors • n(n-1)/2 phase sensitive detection provides phase and quadrature signals corresponding to the output of a n(n-1)/2 matrix of complex correlators beating frequencies phase switching frequencies det. bandpass f
Recovered visibilities Fourier Transform Average Image of the sky Power spectrum
Bandwidth effect. (Green 0%, Blu 10%, Red 20%) Spectral bandpass: the visibility decreases with distance from the zero-path difference (either spatial in image-plane or temporal in pupil-plane interferometer) by modulating the interferometer response with the Fourier Transform of the filter bandpass. The number of fringes is Nf=2/ . Image-plane: reduces the extent of the useful image in the focal plane Pupil-plane: reduces the extent of useful delays
Facts about bolometric interferometry • bolometric interferometer has same sensitivity as array of total power bolometers • clean modulation of input polarization • can measure 4 Stokes parameters simultaneously • different/better systematics (compared with total power expts) • chop phase instead of rotation of polarization vector • no mirrors – use all the available area • great sensitivity – great signal processing • bolo: great sensitivity – poor signal processing • HEMT: poor sensitivity – great signal processing
To measure the B-modes we need the best polarimeter. + Total power polarimeter (like Planck HFI) first detects fields and then obtain Stokes parameters Adding (bolometric) interferometer detects Stokes parameters directly!
correlation polarimeter multiplying interferometer bolometric total power polarimeter
Example of a bolometric total power polarimeter: BICEP • 48 corrugated feed-horns @ 100 and 150 GHz • 96 PSBs • cross-pol 1% • NET 370 K sec
Receiver Architecture (real instrument is 256 horns) corrugated feed-horns Ortho-Mode Transducers (OMT) Rectangular wave-guide phase switches Wave-guide to strip-line transitions Stokes-parameters extraction Built-in SQUID frequency multiplexing one SIS direct detector per line (contains all the beating frequencies)
Systematics: Given the extremely low level signal expected, instrumental systematics must be reduced to a minimum. Unpolarized light polarized signal We claim that an interferometer is the cleanest instrument. Total power PSB Bolometric Interferometer Cross-polarization1% easily <0.1% Opticsneeds lens/mirror clean Gaussian beams 1/f noiseneed to chop the beam clean intrinsic modulation and steer the instrumentmap obtained with no moving Stokes par. recoveringneeds post-detection recovers directly I, Q, U and V differencing
Comparison of estimated polarized foregrounds from synchrotron (magenta), vibrational dust (red),rotational dust (blue), and point source emission (green) from the "middle of the road" Tegmark et al. (1999) model. The shaded regions indicate where the foregrounds contribute more than 0.8 µK.
Sensitivity of Planck HFI 0.1K 1.6K 4K 60K detectors filters horns mirror from A. Lange “Detectors for future CMB observations”
The ultimate sensitivity from A. Lange “Detectors for future CMB observations”
Sensitivity comparison between total power array of bolometers and bolometric interferometer Total # of photons: A: area main dish : solid angle of single pixel Total # of photons: A’: area input horn ’: solid angle of input horn sensitivity is equal when
Same background power on both systems. Bolometric interferometer has N(N-1)/2 N2/2 independent correlators at the same detector noise. Apparently better sensitivity by a factor N, but… Loses a N because of the filling factor, (or window function peak 1/) so same sensitivity d B
Background limited direct detector noise is: Background limited coherent detector noise is: radio-case n>>1 plug-in Dicke eqn. optical-case n<<1 Dicke equation quantity in parenthesis is number of photons in time tau from J. Zmuidzinas May 2000
Direct Coherent Single Dish m single dishes Interferometer 1 arm / 1 detector Interferometer m dishes – m2 baselines Table of Signal/Noise Factors The factor srqt(m) better is apparent because of the filling factor when measuring power spectra.
In the case of a 1002baselines interferometer array, at frequencies above 100 GHz, the bolometric detector has more sensitivity (less NEP) than a coherent interferometer. The advantage is marginal at mm-wavelengths for a ground-based experiment (blue) but becomes bigger for a satellite mission Planck-like (green) to become substantial for an ideal (future?) CMB experiment (red).
A possible instrument concept: • 3 independent interferometers working at 90, 150, 220 GHz • each int. has 256 dual polarization horns for a total of around >20,000 baselines • about 3x512 detectors read by 3 (three!) SQUIDs. Each refers to a sub-band (10%) • All optics @ 4K • CMB photon noise limited
Ground based: fsky=0.2 NET=150μK.s1/2 20,000 baselines, 200 horns, 1 year
Near future polarisation sensitive CMB experiment B-modes experiment???
First Conclusion: Why a bolometric interferometer is good for a B-mode experiment? • Ground-based: atmospheric fluctuations reduced by a big factor (tens or hundreds – M. Jones) • It can measure the 4 Stokes parameters (I, Q, U and V)directly since it multiplies the fields. ANY other total power system has to add/subtract the signals to get the Stokes parameters • Can achieve the required angular resolution WITHOUT the use of any external optics (no primary mirror!). Just horns cooled at 4K. So no extra noise from the optics • Signals can be switched at MHz frequency (if we use SIS detectors) and naturally multiplexed. NO NEED of complex post-detection electronics (e.g. multiplexers) • Little sensitivity to MICROPHONICS. The use of pulse tube coolers coupled with 3He fridges allows extended observations in remote areas (like Dome-C)
Second Conclusion: • mm and sub-mm bolometric interferometry is a promising new technology • 2 different instruments are under consideration: MBI and B-modes • The sensitivity and noise performances estimated are promising • New technologies need to be developed (fast bolometers (TES, SIS, SET) and associated low noise electronics (SQUIDS readout), low-loss wide-band cryogenic phase switches, imaging beam-combiners, etc.)
Noise in a bolometer BLIP: these two guys dominate (hopefully) Johnson + electronics noise where Number of modes in one pol detected in time t and BW Dn