Download
1 / 34
340 likes | 345 Views
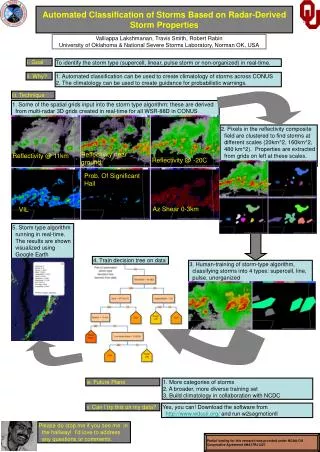
This project aims to automate the extraction of storm characteristics using the WDSS-II K-Means Local Maximum technique, allowing for improved storm classification and support for spatiotemporal queries.

E N D
Automated Extraction of Storm Characteristics Valliappa Lakshmanan National Severe Storms Laboratory & University of Oklahoma http://cimms.ou.edu/~lakshman/ lakshman@ou.edu
Automated Extraction of Storm Characteristics Goal WDSS-II K-Means Local Maximum Summary lakshman@ou.edu
Project 1: Skill Score By Storm Type • Try to answer this question (posed by Travis Smith) • Very critical, but hard to answer based on current knowledge • Is it the type of weather or is it the forecaster skill? • Initially, concentrate on tornadoes • Based on radar imagery, classify the type of storms at every time step • Take NWS warnings and ground truth information for a lot of cases • Compute skill scores by type of storm • Summer REU project • Eric Guillot, Lyndon State • Mentors: Travis Smith, Don Burgess, Greg Stumpf, V Lakshmanan Does the skill score of a forecast office as evaluated by the NWS depend on the type of storms that the NWS office faced that year? lakshman@ou.edu
Project 2: National Storm Events Database • Build a national storm events database • With high-resolution radar data combined from multiple radars • Derived products • Support spatiotemporal queries • Collaboration between NSSL, NCDC and OU (CAPS, CSA) lakshman@ou.edu
Approach • Project 1: How to get classify lots and lots of radar imagery? • Need automated way to identify storm type • Technique: • Cluster radar fields • Extract storm characteristics for each cluster • Associate storm characteristics to human-identified storm type • Train learning technique (NN/decision tree) to do this automatically • Let it loose on entire dataset • Project 2: How to support spatiotemporal queries on radar data? • Can create polygons based on thresholding data • But need to tie together different data sources • Need automated way to extract storm characteristics for querying lakshman@ou.edu
Automated Extraction of Storm Characteristics Goal WDSS-II K-Means Local Maximum Summary lakshman@ou.edu
Warning Decision Support System: Evolution lakshman@ou.edu
Methods • Need way to extract storm characteristics in automated manner • WDSS-II has two techniques to do this • K-Means hierarchical segmentation (w2segmotionll) • Tracking of local maxima (w2localmax) • What about the input data? • WDSS-II provides a variety of CONUS grids and derived products http://www.wdssii.org/ lakshman@ou.edu
WDSS-II CONUS Grids • In real-time, combine data from 130+ WSR-88Ds • Reflectivity and azimuthal shear fields • Use these to derive products: • Reflectivity Composite • VIL • Echo top heights • Hail probability (POSH), Hail size estimates (MESH), etc. • Low-level, mid-level shear • Many others (90+) • Have the 3D reflectivity and shear products archived • Can use these to recreate derived products lakshman@ou.edu
Hail Case (Apr. 19, 2003; Kansas) Reflectivity Composite from KDDC, KICT, KVNX and KTWX lakshman@ou.edu
Echo Top Height of echo above 18 dBZ lakshman@ou.edu
MESH Maximum expected size of hail lakshman@ou.edu
VIL Vertical Integrated Liquid lakshman@ou.edu
Automated Extraction of Storm Characteristics Goal WDSS-II K-Means Local Maximum Summary lakshman@ou.edu
Technique • Identify storm cells based on reflectivity and its “texture” • Merge storm cells into larger scale entities • Estimate storm motion for each entity by comparing the entity with the previous image’s pixels • Interpolate spatially between the entities • Smooth motion estimates in time • Use motion vectors to make forecasts Courtesy: Yang et. al (2006) lakshman@ou.edu
Why it works • Hierarchical clustering sidesteps problems inherent in object-identification and optical-flow based methods lakshman@ou.edu
Trends • What about trends? • Compute properties of current cluster • Min, max, mean, count, histogram, etc. • Project cluster backwards onto previous sets of images • Can use fields other than the field being tracked • Compute properties of projected cluster • Use to diagnose trends lakshman@ou.edu
w2segmotionll Parameters • K-Means segmentation algorithm • Tracks Reflectivity Composite • In data range 20-60 dBZ • Use VIL, MESH, EchoTop, SHI fields • Computes statistics specified in stormType.xml • Starts clustering at size=20 • Minimum size increases 10x, so 2nd scale is 200 and 3rd scale is 2000 • Zero indicates that smaller regions are pruned at coarser scales • Used default values for this slideshow, but 20:50:1 may suit better w2segmotionll -f "VIL MESH EchoTop_18 SHI“ -T MergedReflectivityQCComposite -d "20 60" -X ~/w2config/algs/stormTypeInput.xml -p 20:10:0 lakshman@ou.edu
Identified Cluster IDs (Intermediate Scale) Identified clusters on tracked image lakshman@ou.edu
Identified Clusters (Intermediate Scale) Identified clusters scale=1 lakshman@ou.edu
Identified Clusters (Detailed Scale) Identified clusters scale=0 lakshman@ou.edu
Identified Clusters (Coarsest Scale) Identified clusters scale=2 lakshman@ou.edu
Cluster Table • Three XML tables per frame • One XML table per scale • One row of table per cluster • ID in the table keeps temporal continuity as much as possible • Each identified cluster has these properties: • ConvectiveArea in km^2 • MaxEchoTop and LifetimeEchoTop • MESH and LifetimeMESH • MaxVIL, IncreaseInVIL and LifetimeMaxVIL • Centroid, LatRadius, LonRadius, Orientation of ellipse fitted to cluster • MotionEast, MotionSouth in m/s • Size in km^2 lakshman@ou.edu
Controlling the Cluster Table • Can choose any gridded field for output • From gridded field, can compute the following statistics within cluster • Minimum value, Maximum value • Average, Standard deviation • Area within interval (Useful to create histograms) • Increase in value temporally • Does not depend on cluster association being correct • Computed image-to-image • Lifetime maximum/minimum • Depends on cluster association being correct, so better on larger clusters lakshman@ou.edu
Automated Extraction of Storm Characteristics Goal WDSS-II K-Means Local Maximum Summary lakshman@ou.edu
Technique • This is a more generic version of traditional centroid tracking method • Identify local maxima in the tracked field • Find region of support for each local maximum • Associate regions between frames based on overlap and proximity to expected position • Can use region of support to calculate properties over time lakshman@ou.edu
Local Maxima Tracking • Parameters • Data range to look for local maxima in • Minimum size of a valid region • How many data levels are allowed in a peak lakshman@ou.edu
w2localmax Parameters • Local maximum tracking algorithm • Tracks Reflectivity Composite • In data range 30-60 dBZ • A region can comprise depth of up to 15 dBZ • As small as necessary • Minimum size of 100 km^2 • Better parameters may be needed W2localmax -I MergedReflectivityQCComposite -d "30 60 5“ -D 3 -S 100 -s lakshman@ou.edu
Identified Local Maxima Identified maxima on tracked image lakshman@ou.edu
Identified Local Maxima Identified maxima with regions of support lakshman@ou.edu
Tracking Output • Currently no capability to track other fields and compute their properties • Only properties of tracked field are reported • Average • Maximum • Minimum • Increase in Average, Max and Min • Ellipse fit parameters (centroid, radii, orientation) lakshman@ou.edu
Automated Extraction of Storm Characteristics Goal WDSS-II K-Means Local Maximum Summary lakshman@ou.edu
KMeans vs. LocalMax • Advantages of LocalMax • Cluster ID is more robust across time • Easy to understand rules on what a storm id is • Disadvantages of LocalMax • Not hierarchical although it can be made multi-scale • No tracking of other fields (can be added) • Advantages of K-Means • Hierarchical • Hierarchical is more than just multi-scale • Cluster of detailed scale is inside cluster of coarser scale (“contained”) • Motion estimates are very robust • Time delta properties not dependent on time association of clusters • Disadvantages of K-Means • Cost-function minimization to identify clusters makes it harder to understand • Cluster identification not robust across time • Small changes in image can cause large changes in cluster result lakshman@ou.edu
Way Forward • Determine ideal parameters for each algorithm • Determine storm characteristics that need to be collected • Choose algorithm to use for study • Is true hierarchical clustering needed or is multi-scale enough? • Enhance algorithm if needed to support desired features • Choose data cases • Create storm type truth for row of table for each data case • Train learning system (NN/decision tree) on truthed data • Create data cases for entire year • Run trained system on rest of data • Place output of training set into GIS system • Compute skill score on data set by storm type lakshman@ou.edu