Download
1 / 30
300 likes | 436 Views
Chapter 36. 0. Population Dynamics. European starling. 0. The Spread of Shakespeare’s Starlings The European Starling Has become an abundant and destructive pest in North America. Current. Current. 1955. 1955. 1945. 1935. 1925. 1945. 1905. 1915. 1925. 1935.

E N D
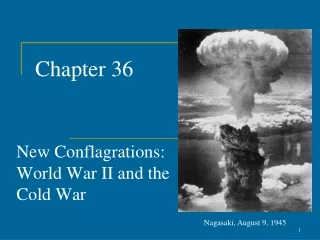
Chapter 36 0 Population Dynamics
Europeanstarling 0 • The Spread of Shakespeare’s Starlings • The European Starling • Has become an abundant and destructive pest in North America
Current Current 1955 1955 1945 1935 1925 1945 1905 1915 1925 1935 The spread of starlings across North America 0 • Starling populations have become very successful • And spread throughout North America since their introduction in 1890
0 • Population ecology • Is concerned with changes in population size and the factors that regulate populations over time
0 • 36.1 Population ecology is the study of how and why populations change • A population • Is a group of individuals of a single species that occupy the same general area
POPULATION STRUCTURE AND DYNAMICS 0 • 36. 2 Density and dispersion patterns are important population variables • Population density • Is the number of individuals of a species per unit of area or volume
Figure 36.2B Figure 36.2A 0 • Environmental and social factors • Influence the spacing of individuals in various dispersion patterns: clumped, uniform, or random
Table 36.3 0 • 36.3 Life tables track mortality and survivorship in populations • Life tables and survivorship curves • Predict an individual’s statistical chance of dying or surviving during each interval of the individual’s lifetime
100 I 10 Percentage of survivors (log scale) II 1 III 0.1 0 50 100 Percentage of maximum life span Figure 36.3 0 • The three types of survivorship curves • Reflect species’ differences in reproduction and mortality
0 • 36.4 Idealized models help us understand population growth
0 • The Exponential Growth Model • Exponential growth • Is the accelerating increase that occurs when growth is unlimited
Time Number of Cells 70 1 2 4 8 16 32 64 512 4,096 16,777,216 68,719,476,736 = 20 = 21 = 22 = 23 = 24 = 25 = 26 = 29 = 212 = 224 = 236 0 minutes 60 20 40 60 80 100 120 50 Number of bacterial cells (N) 40 30 (= 2 hours) 20 G = r N 3 hours 4 hours 8 hours 10 0 120 140 0 20 40 60 80 100 12 hours Time (min) 0 • The equation G rN describes this J-shaped curve • G the population growth rate • r an organism’s inherent capacity to reproduce • N the population size Figure 36.4A
10 8 Breeding male fur seals (thousands) 6 4 2 0 1915 1925 1935 1945 Figure 36.4B Year 0 • Limiting Factors and the Logistic Growth Model • Limiting factors • Are environmental factors that restrict population growth
G = r N (K – N) G = r N K K Number of individuals (N) 0 Time 0 • Logistic growth • Is the model that represents the slowing of population growth as a result of limiting factors • Levels off at the carrying capacity, which is the number of individuals the environment can support Figure 36.4C
0 • The equation G rN(K – N)/K describes a logistic growth curve • Where K carrying capacity and (K – N)/K accounts for the leveling off of the curve
4.0 3.8 3.6 Clutch size 3.4 3.2 3.0 2.8 10 20 30 40 50 60 70 80 0 Density of females Figure 36.5A 0 • 36.5 Multiple factors may limit population growth • As a population’s density increases • Factors such as limited food supply and increased disease or predation may increase the death rate, decrease the birth rate, or both
Exponential growth Sudden decline Number of aphids Apr May Jun Jul Aug Sep Oct Nov Dec Figure 36.5B 0 • Abiotic factors such as weather • May limit many natural populations
80 60 Number of females 40 20 0 1975 1980 1985 1990 1995 2000 Figure 36.5C Time (years) 0 • Most populations • Are probably regulated by a mixture of factors, and fluctuations in numbers are common
Snowshoe hare 160 120 Lynx 9 Lynx population size (thousands) Hare population size (thousands) 80 6 3 40 0 0 1850 1875 1900 1925 Year 0 • 36.6 Some populations have “boom-and-bust” cycles • Some populations • Undergo regular boom-and-bust cycles of growth and decline Figure 36.6
LIFE HISTORIES AND THEIR EVOLUTION 0 • 36.7 Evolution shapes life histories • An organism’s life history • Is the series of events from birth through reproduction to death
Figure 36.7A 0 • Populations with so-called r-selection life history traits • Produce many offspring and grow rapidly in unpredictable environments
0 • Populations with K-selected traits • Raise few offspring and maintain relatively stable populations
Experimental transplant of guppies Predator: Killifish; preys mainly on small, immature guppies Guppies: Larger at sexual maturity than those in pike-cichlid pools Predator: Pike-cichlid; preys mainly on large, mature guppies Guppies: Smaller at sexual maturity than those in killifish pools Figure 36.7B 0 • Life history traits • Are shaped by natural selection
900 800 700 600 Yield (thousands of metric tons) 500 400 300 200 100 0 Figure 36.8 1960 1970 1980 1990 2000 CONNECTION 0 • 36.8 Principles of population ecology have practical applications • Principles of population ecology • Are useful in managing natural resources
6 5 4 Human population size (billions) 3 2 The Plague 1 0 8000 B.C. 4000 B.C. 3000 B.C. 2000 B.C. 1000 B.C. 0 1000 A.D. 2000 A.D. Figure 36.9A THE HUMAN POPULATION CONNECTION 0 • 36.9 Human population growth has started to slow after centuries of exponential increase • The human population • Has been growing almost exponentially for centuries, standing now at about 6.4 billion
16 14 12 New Zealand 10 USA Ecological footprint (ha per person) Germany Australia 8 Netherlands Japan Canada Norway 6 Sweden UK 4 Spain World 2 China India 0 4 0 2 6 8 10 12 14 16 Figure 36.9B Available ecological capacity (ha per person) 0 • The ecological footprint • Represents the amount of land per person needed to support a nation’s resource needs
Traffic in downtown Cairo, Egypt Manhattan, New York City Refugee camp in Zaire Figure 36.9C 0 • The ecological capacity of the world • May already be smaller than the population’s ecological footprint
50 40 30 Birth or death rate per 1,000 population 20 Birth rate Death rate 10 0 1900 1925 1950 1975 2000 2025 2050 Figure 36.10A Year 0 • 36.10 Birth and death rates and age structure affect population growth • The demographic transition • Is the shift from high birth rates and death rates to low birth rates and death rates
Rapid growth Slow growth Decrease Afghanistan United States Italy Age Male Female Male Female Male Female 85+ 80–84 75–79 70–74 65–69 60–64 55–59 50–54 45–49 40–44 35–39 30–34 25–29 20–24 15–19 10–14 5–9 0–4 Primary reproductive ages 8 6 4 2 0 2 4 6 8 6 4 2 0 2 4 6 6 4 2 0 2 4 6 Figure 36.10B Percent of population Percent of population Percent of population 0 • The age structure of a population • Is the proportion of individuals in different age-groups • Affects its future growth
0 • Increasing the status of women • May help to reduce family size