Download
1 / 17
170 likes | 322 Views
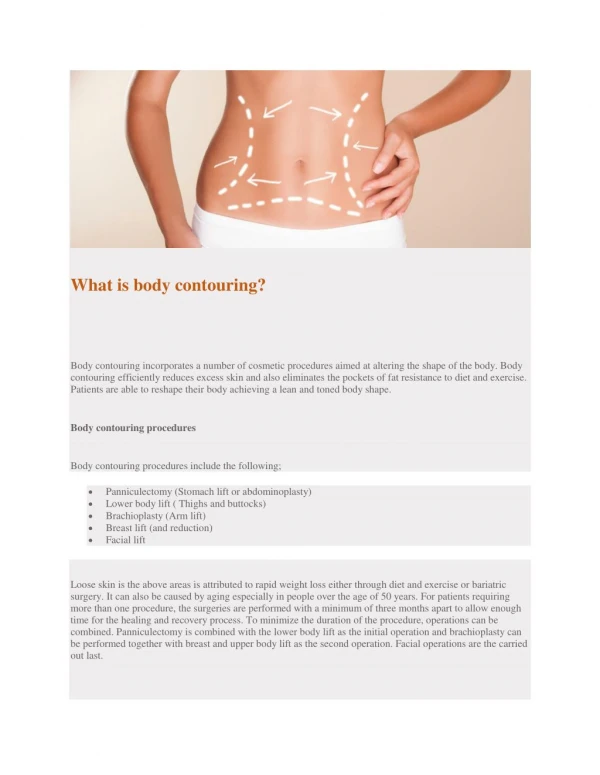
Contouring Data. R. Heath Boucek Master of GIS, Not Power Point. April 1, 2003. Contouring Data: The Basics. Contours are lines that connect points of equal value (such as elevation, temperature, precipitation, pollution, or atmospheric pressure). More of the Basics.

E N D
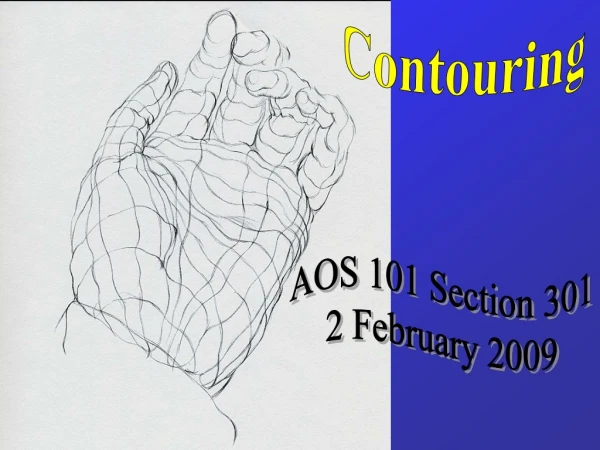
Contouring Data R. Heath Boucek Master of GIS, Not Power Point. April 1, 2003
Contouring Data: The Basics Contours are lines that connect points of equal value (such as elevation, temperature, precipitation, pollution, or atmospheric pressure).
More of the Basics • Contour lines are a familiar way of representing surfaces on maps. • The distribution of the lines show how values change across a surface. Where there is little change in a value, the lines are spaced further apart. Where the values rise or fall rapidly, the lines are closer together.
Some More of the Basics: • Contour lines that cross streams flowing through valleys of noticeable relief will form a V-shaped deflection with the apex of the V pointing upstream • The rule that states a V will always point upstream is the RULE of V's.
A Little More of the Basics: • Even though contours are a common way of representing surfaces on maps they are a poor surface model for computers. • Despite this you can still create contour lines for a whole surface, or you can create a single contour that passes through a certain point.
Why Do We Use Map Contours? • You can identify which areas have the same value by following a contour line. • You can get a general impression of the gradation values by looking at the spacing of contours. • Contour lines are the means of relating the vertical dimension (the third dimension) of the topography of an area to the two-dimensional surface of a topographic map. • Allows you to view a flat image in 3-D
Examples of Ways to Use Contouring • finding the location of atmospheric and oceanic fronts, • locating potential regions of severe thunderstorms, • tracking hurricanes, • tracking the movement of pollutants. • tracing water movement in the oceans
The Contour Function: The Basics • The contour function allows you to create contours for an entire dataset. • Used primarily with elevation • The value which you begin generating contours is The Base Contour. • Contours are generated above and below the base contour as needed to cover entire range of values.
More of the Basics • The specified distance between contour polylines is The Contour Interval . • Every fifth contour line is printed thicker, and then marked with its elevation for reference this is The Index Contour . • The Contour Function is useful and fun!
The How To: • Step 1: Click on 3-D Analyst, point to Surface Analysis, and click Contour • Step 2: Click on Input surface and click the surface you want to contour
More of The How To: • Step 3: Set a Contour interval • Step 4: Set the Base contour to start contouring from or leave the default of 0.
And More of The How To: • Step 5: If needed, set a value for the Z- factor. • Step 6: Change the name for the output or leave the default if you wish. This creates a dataset for later use.
And Finally,Some More of The How To: • Step 7: Click OK • Step 8: Check Your Results
Creating a single contour • Step 1: Click the Create Contours button . • Step 2: Click the surface at the point where you want the contour. • Step 3: The contour is added as a 3D polyline graphic. • Step 4: Admire your work.
Sources • ArcGIS Desktop Help • http://cimss.ssec.wisc.edu/wxwise/contour/contour1.html • Very cool website • http://www.uta.edu/paleomap/geol1435/contour.htm • http://geoweb.tamu.edu/courses/geol101/lab/topo_maps/tsld010.htm