Download
1 / 1
10 likes | 281 Views
Role of Glycemia in Insulin Sensitivity in Adolescents with Type 1 and Type 2 Diabetes. You can put a logo here or on the other side of your title. Suhyla Alam (Eastern Virginia Medical School), Amy West, Maura Downey, Jane EB Reusch, Kristen Nadeau

E N D
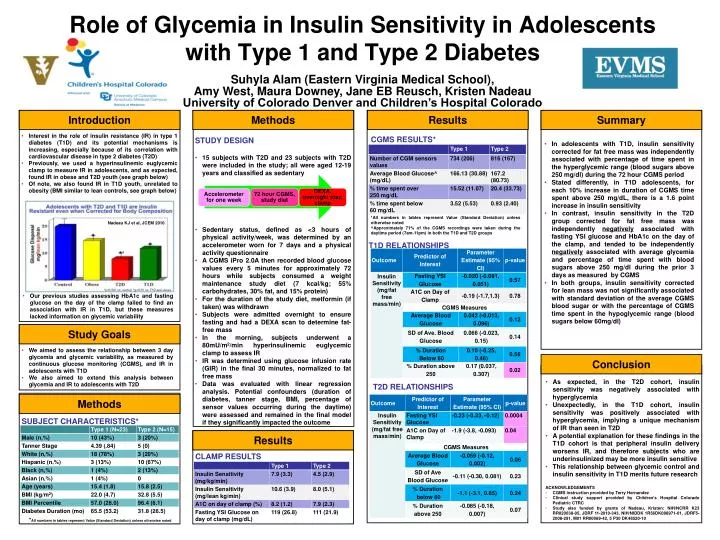
Role of Glycemia in Insulin Sensitivity in Adolescents with Type 1 and Type 2 Diabetes You can put a logo here or on the other side of your title. Suhyla Alam (Eastern Virginia Medical School), Amy West, Maura Downey, Jane EB Reusch, Kristen Nadeau University of Colorado Denver and Children’s Hospital Colorado Introduction Methods Results Summary • Interest in the role of insulin resistance (IR) in type 1 diabetes (T1D) and its potential mechanisms is increasing, especially because of its correlation with cardiovascular disease in type 2 diabetes (T2D) • Previously, we used a hyperinsulinemic euglycemic clamp to measure IR in adolescents, and as expected, found IR in obese and T2D youth (see graph below) • Of note, we also found IR in T1D youth, unrelated to obesity (BMI similar to lean controls, see graph below) CGMS RESULTS* • STUDY DESIGN • 15 subjects with T2D and 23 subjects with T2D were included in the study; all were aged 12-19 years and classified as sedentary • Sedentary status, defined as <3 hours of physical activity/week, was determined by an accelerometer worn for 7 days and a physical activity questionnaire • A CGMS iPro 2.0A then recorded blood glucose values every 5 minutes for approximately 72 hours while subjects consumed a weight maintenance study diet (7 kcal/kg; 55% carbohydrates, 30% fat, and 15% protein) • For the duration of the study diet, metformin (if taken) was withdrawn • Subjects were admitted overnight to ensure fasting and had a DEXA scan to determine fat-free mass • In the morning, subjects underwent a 80mU/m2/min hyperinsulinemic euglycemic clamp to assess IR • IR was determined using glucose infusion rate (GIR) in the final 30 minutes, normalized to fat free mass • Data was evaluated with linear regression analysis. Potential confounders (duration of diabetes, tanner stage, BMI, percentage of sensor values occurring during the daytime) were assessed and remained in the final model if they significantly impacted the outcome • In adolescents with T1D, insulin sensitivity corrected for fat free mass was independently associated with percentage of time spent in the hyperglycemic range (blood sugars above 250 mg/dl) during the 72 hour CGMS period • Stated differently, in T1D adolescents, for each 10% increase in duration of CGMS time spent above 250 mg/dL, there is a 1.6 point increase in insulin sensitivity • In contrast, insulin sensitivity in the T2D group corrected for fat free mass was independently negatively associated with fasting YSI glucose and HbA1c on the day of the clamp, and tended to be independently negatively associated with average glycemia and percentage of time spent with blood sugars above 250 mg/dl during the prior 3 days as measured by CGMS • In both groups, insulin sensitivity corrected for lean mass was not significantly associated with standard deviation of the average CGMS blood sugar or with the percentage of CGMS time spent in the hypoglycemic range (blood sugars below 60mg/dl) *All numbers in tables represent Value (Standard Deviation) unless otherwise noted ^Approximately 71% of the CGMS recordings were taken during the daytime period (7am-11pm) in both the T1D and T2D groups Nadeau KJ et al, JCEM 2010 T1D RELATIONSHIPS • Our previous studies assessing HbA1c and fasting glucose on the day of the clamp failed to find an association with IR in T1D, but these measures lacked information on glycemic variability Study Goals • We aimed to assess the relationship between 3 day glycemia and glycemic variability, as measured by continuous glucose monitoring (CGMS), and IR in adolescents with T1D • We also aimed to extend this analysis between glycemia and IR to adolescents with T2D Conclusion • As expected, in the T2D cohort, insulin sensitivity was negatively associated with hyperglycemia • Unexpectedly, in the T1D cohort, insulin sensitivity was positively associated with hyperglycemia, implying a unique mechanism of IR than seen in T2D • A potential explanation for these findings in the T1D cohort is that peripheral insulin delivery worsens IR, and therefore subjects who are underinsulinized may be more insulin sensitive • This relationship between glycemic control and insulin sensitivity in T1D merits future research • ACKNOWLEDGEMENTS • CGMS instruction provided by Terry Hernandez • Clinical study support provided by Children’s Hospital Colorado Pediatric CTRC • Study also funded by grants of Nadeau, Kristen: NIH/NCRR K23 RR020038-05, JDRF 11-2010-343, NIH/NIDDK 1R56DK088971-01, JDRF5-2008-291, M01 RR00069-42, 5 P30 DK48520-10 T2D RELATIONSHIPS Methods SUBJECT CHARACTERISTICS* Results CLAMP RESULTS *All numbers in tables represent Value (Standard Deviation) unless otherwise noted