Download
1 / 35
350 likes | 442 Views
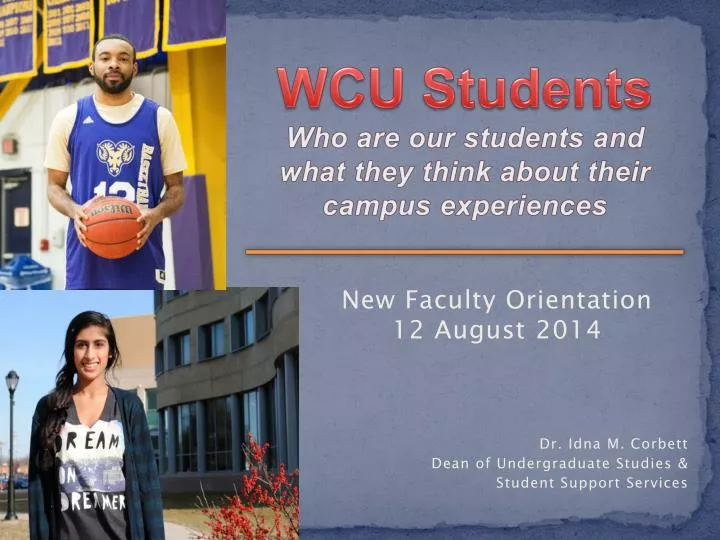
WCU Students Who are our students and what they think about their campus experiences. New Faculty Orientation 12 August 2014 Dr. Idna M. Corbett Dean of Undergraduate Studies & Student Support Services. 1. WCU has how many undergrads…?. 10,000 – 12,000 12,000 – 14,000

E N D
WCU StudentsWho are our students and what they think about their campus experiences New Faculty Orientation 12 August 2014 Dr. Idna M. Corbett Dean of Undergraduate Studies & Student Support Services
1. WCU has how many undergrads…? • 10,000 – 12,000 • 12,000 – 14,000 • More than 15,000
2. How diverse is our UG student population? • 12% Minority • 14% Minority • 16% Minority
3. How diverse is our Grad student population? • 15% Minority • 17% Minority • 19% Minority
Some WCU Fast Facts Demographic Distribution • Total undergraduate enrollment for Fall semester
Graduate Students Demographic Distribution • Total graduate enrollment for Fall semester
Special UG Populations - New Out-of-State Students Active 478 20.3% of the class African American Students Active 295 13.4% of the class Hispanic Students Active1275.4% of the class
True/False? • Transfer students represent about 45% of the undergrad student population. • More than 70% of WCU students are first generation college goers. • More than a third of WCU students are classified as low income. • 90% of incoming students expect to earn a B average or better.
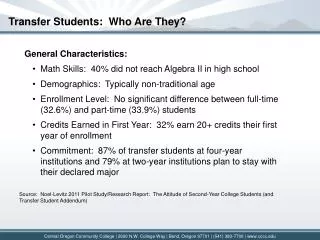
The Incoming Transfer Students Most popular majors: Biology Psychology Pre-Business Early and Middle Grades Kinesiology Nursing Nutrition Pre-Major
First- to Second-Year Retention Rate (2013) * CollegeMeasures.org ¤Education Trust
FY Admit Types • Regular Admission (FY1) • Academic Development Program – Act 101 (FY2) • Academic Development Program – Non-Act 101 (FY3) • Motivation (FY4)
First Generation College Goers Underrepresented minority students are more likely to be first-generation college students.
Success is determined by college experiences as much as pre-enrollment experiences
Intersection between low-income and first-generation status • 4 times as likely to drop out • Persistence, tenacity, high motivation • Independent and self-reliant • Lack the cultural and social capital
Curse of Knowledge • Once we know something… we find it hard to imagine not knowing it. Our knowledge has “cursed” us. We have difficulty sharing it with others, because we can’t readily re-create their state of mind. (Heath & Heath, 2006, Harvard Business Review) • What is common knowledge for faculty/staff, or current students, is a mystery for new students and particularly for LI/FG students.
Shock vs. Ecstasy • May feel separated from family and friends in home community as a result of upward mobility and exposure to a new campus culture • May experience “impostor syndrome” or unwarranted feelings of inadequacy • They may see failure before it happens • I’m ready for the fun of college! • Have a glamorized perception of college • “You Only Live Once” • Not realize the effects on their future of decisions they make now
For FGCS, college is like giving someone a big bag with jigsaw puzzle pieces without giving them the box with the picture. Dorothy Ward, UTEP
How can Faculty help? • Reach out before help is needed • Recognize the role of the classroom in students’ campus life • Find out if students are commuting • Interact frequently in and out of class ― Say more than “come to my office hours” • Encourage students to collaborate and help each other • Support students’ belief that they can learn
Monitor student success • Class attendance • Missing assignments • Low engagement in class discussions Participate in Early Alert
Help students develop a sense of belonging • Recognize that for some students being a college student is not the most important role in their lives • Facilitate early connection to resources • Join the network of support • Learn to teach the students that you have, not the students you wish you had • Practice… • Acceptance • Empowerment • Advocacy
Two Related Surveys • Beginning College Survey of Student Engagement (BCSSE) • First-year only, during orientation • 1,593 respondents • National Survey of Student Engagement (NSSE) • First-year and seniors only • Response rate: FY 27%, Seniors 31% • 1,828 respondents
From what type of high school did you graduate? • Public 86% • Private, religiously-affiliated 12% • Private, independent 1% BCSSE 2013
In college, how many hours will you spend in a typical 7-day week? BCSSE 2013
Amount of time spent in • Preparing for class • 11+ hr/wk FY 59% SY 58% • Working for pay off campus • 6+ hr/wk FY 25% SY 74% • Relaxing and socializing • 1-10 hr/wk FY 45% SY 52% • 16+ hr/wk FY 31% SY 25% • The majority of FY students (80%) and seniors (79%) say they spend “significant amounts of time studying and on academic work.” NSSE 2013
How prepared are you to do the following in your academic work at this university? Combined responses of “5,” and “6” on a six-point scale where 6 is “Very prepared.” BCSSE 2013
During the coming school year, how difficult do you expect the following to be? Combined responses of “5,” and “6” on a six-point scale where 6 is “Very difficult.” BCSSE 2013
What do you expect most of your grades will be at this university during the coming year?(Select only one) BCSSE 2013
Quality of Interactions • The quality of relationships with faculty. (Percent responding Helpful, Available: 4-7) • FY 91% - 86%SY92% - 93% • The quality of relationships with administrative personnel and offices (Percent responding Helpful, Considerate, flexible: 4-7) • FY 83% - 72%SY 73% - 71% • The quality of relationships with other students. (Percent responding Friendly, Supportive, Sense of belonging: 4-7) • FY 92% - 95%SY 93% - 93% NSSE 2012 - 2013
Progression toward a degree • Changed your major (at least once) 39%36% • Delayed your graduation plans because courses were not available when needed (at least once) 31%33% 2012 / 2013
If you could start over again, would you go to the same institution you are now attending? • Probably Yes Definitely Yes • FY – 45%42% • SY – 40%45% NSSE 2013