Download
1 / 12
120 likes | 236 Views
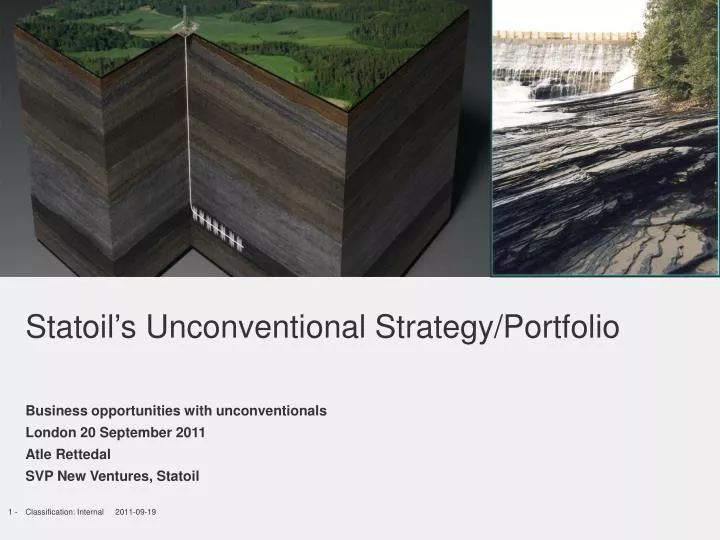
Statoil’s Unconventional Strategy/Portfolio. Business opportunities with unconventionals London 20 September 2011 Atle Rettedal SVP New Ventures, Statoil. Data from World Energy Outlook, US Geological Survey , US Energy Information Administration and World Coal Association.

E N D
Statoil’s Unconventional Strategy/Portfolio Business opportunities with unconventionals London 20 September 2011 Atle Rettedal SVP New Ventures, Statoil
Data from World Energy Outlook, US Geological Survey , US Energy Information Administration and World Coal Association Global energy resources Methane hydrates 2-120 Tbbl Coal Resources 30+ Tbbl Tight EHO CBM Oil shale Oil sand Conv. Shale Conv. Oil produced Oil resources Gas produced Gas resources Coal 1,1 Tbbl 8,8 Tbbl 0,4 Tbbl 7,8 Tbbl 2 - 2 - Classification: Internal (Restricted Distribution) 2011-09-05 Classification: Internal (Restricted Distribution) 2011-09-06Classification: Internal (Restricted Distribution) 2011-09-05
Statoil shale Assets Track record 2011/2012 delivery Long term materiality Cost curve post tax breakeven Statoil to operate Production USD/mcf mboed 10 0 500 1,000 Resource potential, Tcf 2010 2020 • Early access to positions at low end of the cost-curve at attractive prices • Partnerships and secondments to build capabilities • Accessed midstream position • Kai Kos Dehseh transaction • Kai Kos Dehseh operations • Successful start-up • Ramping up production • Taking on operatorship in Eagle Ford • Substantial production growth • Innovate & leverage skill-base • Apply subsurface competence • Establish technology hubs Apply technology to expand in unconventionals Kai Kos Dehseh Marcellus Eagle Ford
Statoil’s US Shale Portfolio • Marcellus (dry gas): • Acquired 32.5% of Chesapeake’s interest in the Marcellus shale • Eagle Ford (rich gas): • Acquired 50% of Enduring’s acreage with Talisman as partner • Shared operatorship
Statoil’s Marcellus asset Statoil-Chesapeake Joint Venture • JV with Chesapeake Energy since Nov. 2008 • Statoil: 682,000 Net Acres • Top tier acreage positions in two core areas • Utica (liquids) potential • ~30 JV operated rigs • 50,000 boepd target in 2012 • Low cost F&D • Low cost early entry Nov 2008 ------- 6 - Classification: Internal (Restricted Distribution) 2011-06-22Classification: Internal (Restricted Distribution) 2010-12-11Classification: Internal (Restricted Distribution) 2010-12-10Classification: Internal (Restricted Distribution) 2010-12-10Classification: Internal (Restricted Distribution) 2010-12-09Classification: Internal (Restricted Distribution) 2010-12-07Classification: Internal (Restricted Distribution) 2010-12-03Classification: Internal (Restricted Distribution) 2010-11-30Classification: Internal (Restricted Distribution) 2010-07-28Classification: Internal (Restricted Distribution) 2010-07-28Classification: Internal (Restricted Distribution) 2010-07-28Classification: Internal (Restricted Distribution) 2010-07-28Classification: Internal (Restricted Distribution) 2010-07-26Classification: Internal (Restricted Distribution) 2010-07-26Classification: Internal (Restricted Distribution) 2010-07-23Classification: Internal (Restricted Distribution) 2010-05-06Classification: Internal 2010-04-15Classification: Internal 2010-04-12 Classification: Internal (Restricted Distribution) 2011-05-18Classification: Internal 2011-05-17Classification: Internal 2011-05-09 Classification: Internal 2011-05-17Classification: Internal 2011-05-09 Classification: Internal 2010-06-02Classification: Internal 2010-05-20Classification: Internal 2010-04-16 Classification: Internal 2010-05-20Classification: Internal 2010-04-16 Classification: Internal 2010-04-16
Statoil’s Eagle Ford asset Statoil-Talisman Joint Venture • Joint Venture with Talisman since Dec. 2010 • Pathway to operatorship for Statoil • Statoil: 67,000 net acres • Growth opportunities • 5 JV operated rigs today. 8 by year end • About 60% of revenue expected from liquids • Low cost early entry Nov 2009 ------- 7 -
Local impact Land-based shale involves frequent interaction with local stakeholders Fit for purpose impact assessments and sound CSR and HSE measures crucial to success Land access The US is unique in terms of coupling land access and resource access All relevant countries outside US will involve: Access to resources through government Access to land through negotiations and relationship with authorities and land owners Local stakeholders and land access
Increasing unconventional share of global M&AGlobal M&A spend by asset type Source: Wood Mackenzie M&A Service (September 2011)
Our ambition towards 2020Industrial position in North America – Global long-term options Options North American cluster • Provide sufficient scale for an industrial position • Put Statoil in Top 5-10 for shale • Continue the NA growth trajectory of 2-3x production growth every 5 years Global growth portfolio • Take positions in emerging plays to create a strong portfolio by 2015 Ambition Immature plays Proved plays Eagle Ford Marcellus • 1 based on today’s market concentration and the expected shift towards unconventionals
Emerging views of gas resources globally Canada Legend: Europe Range of technically recoverable gas resources (tcf) EIA: 388 tcf USA WM: 202 tcf EIA: 639 tcf Shale gas CBM Tight gas EIA: 862 tcf WM: 126 tcf WM: 585 tcf China EIA: 1275 tcf High Mexico Other Asia Pacific Africa 681 tcf EIA: 114 tcf EIA: 1042 tcf Low WM: 35 tcf South America EIA: 1225 tcf WM: 129 tcf Australia EIA: 396 tcf WM: 21 tcf WM: 69 tcf • Estimates outside NA are immature and based on a limited data set • CBM and tight gas estimates reflect limited research coverage Sources: WoodMackenzie (WM) (2011), US Energy Information Administration (2011), Advanced Resources International (2009), IHS Cera (2010/11) Note: The estimates are based on different evaluation methods and include different unconventional plays which makes them not directly comparable.
Thank you Atle Rettedal Senior Vice President aret@statoil.com www.statoil.com