Download
1 / 19
190 likes | 270 Views
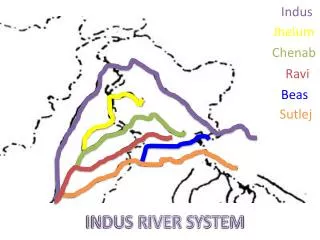
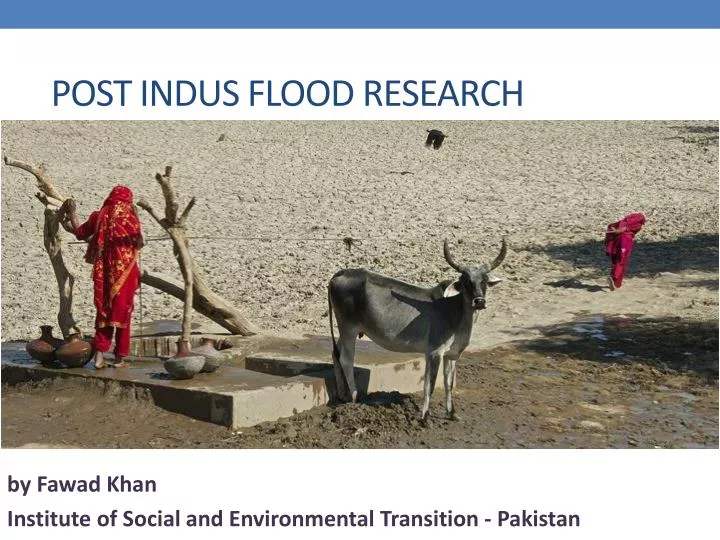
Post Indus Flood Research. Presentation to Board Members of RSPN - Revisited b y Fawad Khan Institute of Social and Environmental Transition - Pakistan.

E N D
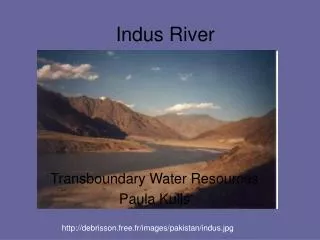
Post Indus Flood Research Presentation to Board Members of RSPN - Revisited by Fawad Khan Institute of Social and Environmental Transition - Pakistan
Hotspot: This map shows areas of relatively high pressure (red) over Russia and the resulting low pressure (blue) over Pakistan in August 2010
This map shows how rainfall built up over Pakistan from the beginning of July through to the end of August
Table 1: recorded Rainfall During the four Day wet Spell of July 27 to July 30, 2010 *indicates new record Source: Annual Flood Report 2010, Government of Pakistan, Ministry of Water and Power.
IDRC-DFID funded research with RSPN and member RSPs Four main outputs • Links between services and recovery • Generalized vulnerability index • Demography (gender) and recovery • Desk study on recovery process
Conceptual Framework • Post flood vulnerability/resilience analysis • The ability of a social or ecological system to absorb disturbances while retaining the same basic structure and ways of functioning, the capacity for self-organisation, and the capacity to adapt to stress and change (IPCC WG2 2007: 880). • Recovery rates • Systems and access to systems • Eco-system services (air, water, forest, pastures etc.) • Gateway services (water, health, education, communication, finance etc.) • Higher level systems (institutions, governance etc.) • Identifying critical systems for building resilience • Adaptive capacities
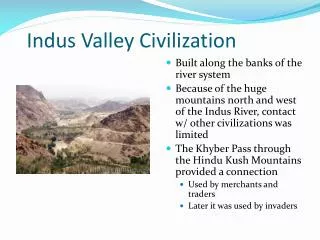
Site Selection Chitral in High Mountains Charsadda in Piedmont area Dadu in low plains Tharparkar in Desert/Coastal areas
Methodology • Identify under-serviced areas/populations using census. • In post disaster situation identify vulnerable and resilient through recovery status (SLD/survey) • Document service availability differential between resilient and vulnerable (quantity, quality,time) • Identify critical services that build resilience through statistical testing • Shared learning process to determine causation
Electricity as a Gateway service • Communities in Chitral in a maladaptive cycle • Flash floods • Commercial logging • Remarkable socio-economic outcomes • Education • Skills/Computers • Employment • Micro-credit and enterprise • Communication • Micro Hydel in one village (12+ yrs) • Ban on commercial logging
Conclusions • Services do differentiate between fast and slow recovery • These services are dependent on physical (geographic) and social conditions (level of development) • No generic solution for adaptation • These can be methodically identified for each area • Development interventions can increase resilience for communities vulnerable to climate change