Download
1 / 29
290 likes | 447 Views
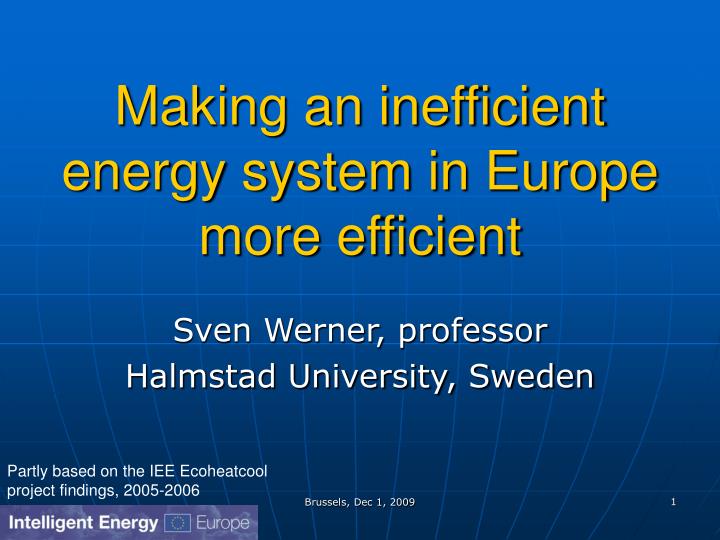
Making an inefficient energy system in Europe more efficient. Sven Werner, professor Halmstad University, Sweden. Partly based on the IEE Ecoheatcool project findings, 2005-2006. Outline. Inefficient energy system in Europe Heat recycling can increase the system efficiency

E N D
Making an inefficient energy system in Europe more efficient Sven Werner, professor Halmstad University, Sweden Partly based on the IEE Ecoheatcool project findings, 2005-2006 Brussels, Dec 1, 2009
Outline • Inefficient energy system in Europe • Heat recycling can increase the system efficiency • Expansion of current district heating systems and the available resources • Two time horizons: 2020 and 2050 • Barriers for expansion of district heating systems • Some concluding proposals Brussels, Dec 1, 2009
1. Input-output analysis in 4 steps Brussels, Dec 1, 2009
1. Some activities are more inefficient than others Brussels, Dec 1, 2009
1. Some activities are more inefficient than others Brussels, Dec 1, 2009
1. Some activities are more inefficient than others Recycling of heat losses Brussels, Dec 1, 2009
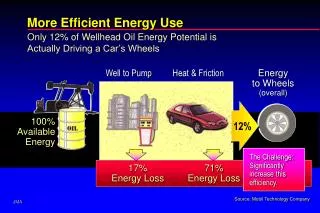
1. Inefficiency conclusions • The EU27 energy system generates large amounts of conversion heat losses (60 % of the input) due to energy inefficiency. • Inefficient parts dominate the energy system. • The most efficient part is small: The 5000+ district heating systems recycle only 2 EJ. Hereby, the total conversion heat losses are reduced from 48 to 46 EJ. Brussels, Dec 1, 2009
2. Heat recycling and renewable resources today in European district heating systems • Thermal power plants, also called Combined Heat and Power (CHP) or Cogeneration, using 8% of total available heat resources • Waste incineration in Waste-to-Energy plants, using 7% of total available non-recycled waste • Industrial processes having useful waste heat flows, using less than 3% of total available heat resources • Biomass, using 1% of the current potential • Geothermal, using 80 ppm of the current potential Brussels, Dec 1, 2009
2. The fundamental idea Brussels, Dec 1, 2009
2. Heat supply composition Brussels, Dec 1, 2009
3. Expansion possibilities • Current district heat market share is less than 10% in EU27 • Doubling market share and improving the energy supply will give substantial benefits: • Lower carbon dioxide emissions, 400 million tons per year • Lower import dependence, 4.5 EJ • Lower primary energy supply, 2.1 EJ Brussels, Dec 1, 2009
3. District heating: The five strategic heat flows Brussels, Dec 1, 2009
3. Expansion possibility – geothermal resources Brussels, Dec 1, 2009
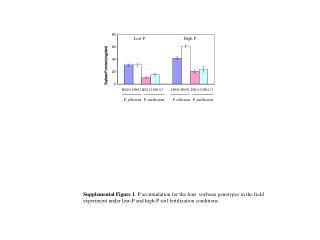
3. Use of combustible renewables vs forest growth Figure 18. National per capita combinations of total primary energy supply of combustible renewables (excluding the biomass part in municipal waste) and the net annual increment of the forest growing stock. Reference lines added for 20% and 100% fuel use of the net annual increment, assuming a net calorific value of 7,3 GJ/m3 ob. Brussels, Dec 1, 2009
3. Expansion potential • Half of the short term expansion potential in EU27 can be found in Germany, France and United Kingdom. The corresponding residential market shares for district heating are currently 13 %, 5 %, and 1%, respectively. Brussels, Dec 1, 2009
4. Two time horizons • 2020, short term mitigation time horizon: Most changes must be fulfilled within the existing energy system with a low share of new technology • 2050, long term mitigation time horizon: Possibility to create a completely new energy system with a high share of new technology Brussels, Dec 1, 2009
4. Short term example: Fast extensive natural gas substitution by heat recycled from a large pulp mill The extension of the district heating system in Varberg has increased the district heat market share from 6% to 45%. The corresponding carbon dioxide emissions have decreased with 40%. Brussels, Dec 1, 2009
4. Long term example: Everything is possible in 40 years Brussels, Dec 1, 2009
5. The main barriers for higher energy efficiency • Low cost fossil fuels • Our legislations relate mostly to use of fossil fuels and do not recognise energy efficiency • Carbon taxes and carbon dioxide trading are in general not strong enough • City mitigation projects requires often local actors, not always present today • Short term investment horizons in energy companies Brussels, Dec 1, 2009
6. Some concluding proposals • Redesign all legislation to consider energy efficiency • Do not allow large heat losses without heat recycling in new power or industrial plants, according to the best available technology (BAT) principle in the IPPC directive • Redesign all international energy statistics to consider energy efficiency and distributed generation • Use only Joule (J) as energy unit, giving a more transparent energy market Brussels, Dec 1, 2009
The End Thank you for your attention! Brussels, Dec 1, 2009
Some back-up slides Brussels, Dec 1, 2009
Final consumption by customers before local conversion losses Brussels, Dec 1, 2009
Our common history Brussels, Dec 1, 2009
Electricity och gas dominates in Europe (2003) Brussels, Dec 1, 2009
2003: Residential electricity och heat demands % Brussels, Dec 1, 2009
German cities Brussels, Dec 1, 2009
French cities Brussels, Dec 1, 2009
Dutch cities Brussels, Dec 1, 2009