Download
1 / 13
130 likes | 458 Views
Gantt Charts. Trisha Cummings. The History. Henry Laurence Gantt's legacy to management is the Gantt chart. Henry Laurence Gantt (1861-1919) was a mechanical engineer, management consultant and industry advisor.

E N D
Gantt Charts Trisha Cummings
The History • Henry Laurence Gantt's legacy to management is the Gantt chart. • Henry Laurence Gantt (1861-1919) was a mechanical engineer, management consultant and industry advisor. • Henry Laurence Gantt developed Gantt charts in the second decade of the 20th century. • Gantt charts were used as a visual tool to show scheduled and actual progress of projects. • Accepted as a commonplace project management tool today, it was an innovation of world-wide importance in the 1920s. • Gantt charts were used on large construction projects like the Hoover Dam started in 1931 and the interstate highway network started in 1956.
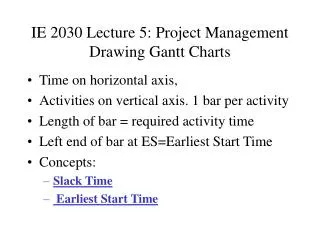
ABOUT GANTT CHARTS • The chart is a graphical representation of the duration of tasks against the progression of time. • The chart is a useful tool for planning and scheduling projects. • The chart is helpful when monitoring a project's progress.
Planning and Scheduling • This chart allows you to assess how long a project should take. • This chart lays out the order in which tasks need to be carried out. • This chart helps manage the dependencies between tasks.
Monitoring A Project • Here the chart allows you to see immediately what should have been achieved at a point in time. • Also the chart allows you to see how remedial action may bring the project back on course.
Buzz Word and Their Meanings • Actual Cost for Work Performed (AC) -Total amount spent on a task up to the current date. • Budget At Completion (BAC) - Overall approved budget for a task. • Budget - A fiscal plan of operations for a given time period. • Burden - Overhead expenses allocated for a project's direct labor or material.
Cost/Schedule Control System Criteria (C/SCSC) - A set of 35 defined standards. Since 1967, these standards have been used to ensure the government that contracts are managed properly. In December of 1996, these 35 standards were superseded by 32 earned value management standards. • Cost Variance - The difference between the BCWP (earned value) and the ACWP (actual costs) • Cost Performance Report (CPR) - A cost report, generated monthly by the contractor to show cost and schedule information. • Cost/Schedule Status Report (C/SSR) - A report used for smaller value contracts which don't warrant the full C/SCSC, showing cost and schedule.
Demonstration Review (DR) - The first formal review of a contractor's control system to determine whether the system meets C/SCSC requirements. • Earned Value (EV) - Earned value is synonymous with the term BCWP (Budget Cost for Work Performed). The actual measured performance; the value of the completed work. • Estimate at Completion (EAC) - A value which represents the expected cost of the project at completion. EAC shows the actual costs to date plus the estimated cost for completing the project.
Estimate to Completion (ETC) - Represents the value of the work required to finish a task. • Extended Subsequent Applications Review (ESAR) - Performed instead of a C/SCSC review when contractor conditions have changed. (contractor moves, work moves into a new phase, or when other changes occur) • Level of Effort (LOE) - Work which doesn't yield a final product. Examples: coordination, follow-up and other support activities.
Milestone - An important event. • Organizational Breakdown Structure (OBS) - A structure which shows work responsibilities. The top level shows top management and the structure is detailed downward to the lower levels of management. • Statement of Work (SOW) - A document describing the work to be done on the contract. • Work Breakdown Structure (WBS) - A tree-like representation of the work to be done on a project. The WBS graphically shows the division of work.
Software And Credits • http://www.ganttchart.com/History.html