Download
1 / 48
510 likes | 791 Views
Working Capital Management. Case Study – Textile spinning . PRESENTED BY : CA – PRADIP MODI Member Advisory Board, PKM ADVISORY SERVICES PVT. LTD. AHMEDABAD MOBILE : 9824014310, Phone : + 91 79 4006 5204. FINANCING OF AN ENTERPRISE BUSINESS ACTIVITY – Trading

E N D
Working Capital Management Case Study – Textile spinning PRESENTED BY : CA – PRADIP MODI Member Advisory Board, PKM ADVISORY SERVICES PVT. LTD. AHMEDABAD MOBILE : 9824014310, Phone : +91 79 4006 5204
FINANCING OF AN ENTERPRISE BUSINESS ACTIVITY – Trading – Manufacturing – Green Field – Expansion – Diversification FINANCING PATTERN Trading – Short Term – Annual basis – Working Capital Manufacturing – Long Term – 5 to 7 years – Term Loan Short Term – Annual basis – working capital Working Capital – Fund Based Non fund based – letter of credit – guarantee Term Loan – Rupee Loan – Foreign Currency – ECB – Debentures – Private Equity SOURCES OF FINANCING Banks Financial Institutions Non Banking Financing Companies
HISTORY OF BANKING IN INDIA Reserve Bank of India commenced operation from April, 1, 1935. Through Reserve Bank of India Act, 1934 (II of 1934) 1949 – Enactment of Banking Regulation Act. RESERVE BANK OF INDIA played a special role in the context of Development Instrumental in setting up Development Institutions Setup Institutions to build the financial infrastructure Deposit Insurance and credit guarantee corporation of India Unit Trust of India The Industrial Development Bank of India (IDBI) The National Bank of Agricultural and Rural Development (NABARD) The Discount & Finance house of India.
PHASE I General Bank of India – 1786 Bank of Bengal – 1809 Bank of Bombay – 1840 Established by The East India Company, Bank of Madras – 1843 Merged into imperial bank in 1920. 1865 onwards banks were established exclusively by indians. PHASE II Banking Sector Reforms Imperial Bank was nationalised in 1955 – State Bank of India was formed Seven Banks forming subsidiaries of State Bank of India were nationalised in 1960. 14 Major commercial banks were nationalised on 19th July 1969. PHASE – III 1991– Indian economy opened up Liberalisation of banking practices Continuing Government control with public participation.
BANKING INDUSTRY in retrospect. 1) PRE-NATIONALISATION (private ownership) Prior to 1969, focus more on individual credibility of borrower rather than huge paper work. Setbacks were largely absorbed by corporate houses who owned them. 2) POST NATIONALISATION Pre – supposed social objectives with specific mandate to banks; i) To expand branch network – mostly in rural India. ii) Flow of credit to rural and SSI sector – Approach at times that banking industry should sacrifice, if required in achieving social goal (not scientifically defined) – known as Loan Mela. 3) POST – LIBERALISATION (Precisely 1990 onwards) Economy to global competition. Focus shifted to better risk management and improving quality of assets. More transparent system to reflect true financial position of banks.
Systematic efforts initiated first time in 1991 for performance evaluation of the borrower and lenders. Committee under the Chairmanship of Mr. M. Narsimham – 1) To study prevailing financial system, 2) To identify shortcomings and weakness 3) To prescribe norms to make the disclosure practices more transparent and meaningful. Report tabled in parliament on 17.12.1991.
RECOMMENDATIONS PRUDENT ACCOUNTING NORMS FOR INCOME RECOGNITION To make if more objective based on record and recovery rather than subjective considerations like availability of security, net worth of borrower and guarantors (even though, importance given on security and net worth as banking system requires).
BANKING – WORKING CAPITAL LENDING PROCEDURE Prior to Tondon / Chore Committee Recommendations Through credit authorisation system – centralised Branch Office – Regional office – Zonal office – Head Office – RBI – CAS Queries – RBI – Head Office – Zonal Office – Regional Office – Branch office COMMITTEE RECOMMENDATION – DECENTRALISED Methodology Norms of Current assets in major industries End – use criteria Maximum Permissible Bank Finance Emphasis on loan systems Periodic Information and reporting system
CREDIT MONITORING ARRANGEMENT (CMA) • STRUCTURE • PROFITABILITY PROJECTIONS – OPERATING STATEMENT • Past two years’ – Audited. • Current year – estimated • Next year – projected • BALANCE SHEET ANALYSIS • A. I) Current liabilities • a) Bank Borrowing – Working Capital limit. • b) Current liability – payable within one year • c) Total current liabilities – (a) + (b) • Long Term Liabilities – Payable after one year • a) Total outside liabilities • Net worth Equity + Reserves & Surplus. • TOTAL • I) Current Assets – Assets realisable within one year • ii) Deferred current assets – more than one year. • iii) Gross Fixed assets – Depreciation = Net fixed assets • iv) TOTAL
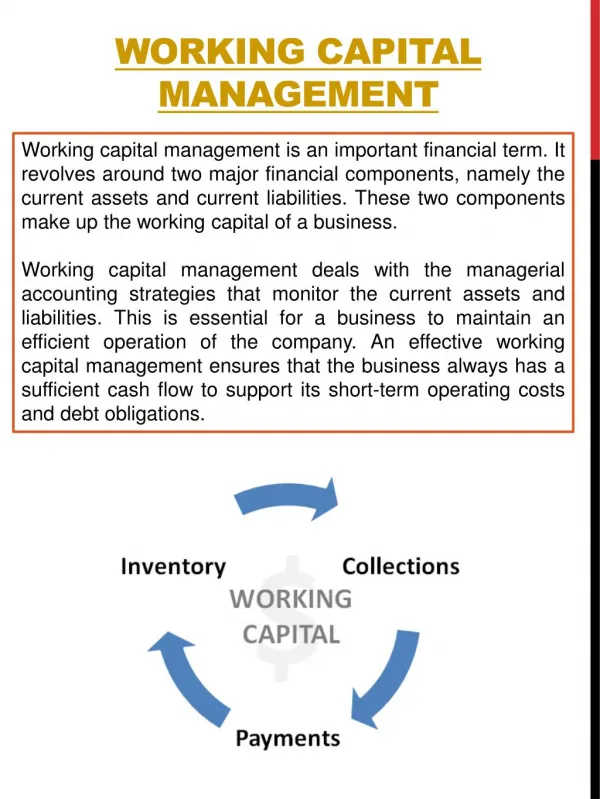
WORKING CAPITAL – DEFINITION • The funds which are used to manage day to day business operations • Current Assets – Current Liabilities • CURRENT ASSETS • Inventory - Raw materials - Work in progress - Finished goods - Stores, spares, Packing material • Receivables • Cash & Bank Balance • CURRENT LIABILITEIS • Trade Creditors • Expenses – Provisions – Payable within one years • Assessed on an annual basis • Assets conversion cycle through operations
ASSESSMENT OF WORKING CAPITAL Maximum Permissible Bank Finance (MPBF) Tondon Committee Recommendations Method – I Promoters 25% of net working capital (Current Assets – Current Liabilities) Method – II Promoters 25% current assets Method – III 100% of hard core assets + 25% of other current assets Chore Committee discarded method III and recommended Method II Method II Known as MPBF Working Capital Gap Method
CMA - DATA FORM – I Particulars of Existing and Proposed Limits FORM – II Operating Statement FORM – III Analysis of Balance Sheet FORM – IV Comparative Statement of Current assets & Current Liabilities FORM – V Computation of Maximum Permissible Bank Finance (MPBF) FORM –IV Funds Flow Statement
PROJECT APPRAISAL Till the year 2000 Project Funding was done by Financial Institutions 1) State Financial Corporations. 2) Industrial Development Bank of India (IDBI). 3) Industrial Finance Corporation of India (IFCI) 4) Industrial Credit and Investment Corporation of India (ICICI). 5) Small Industrial Development Bank of India (SIDBI). Working capital provided by commercial banks. Funding pattern is changed. IDBI & ICICI transformed into full fledged banking Commercial Banks provide both Term Loans and Working Capital.
PROJECT APPRAISAL A process to assess various aspects for arriving at a financing decision. • Managerial Competence – Resourcefulness, competence and integrity of the management. • Technical Feasibility – Appropriate Technology to maintain quality and cost competitiveness. Availability of skilled management team • Commercial Feasibility – Detailed market survey – both desk and field survey. • Financial Feasibility i) Cost of production & Projected profitability. ii) Balance Sheet and Cash flow statement. iii) Financial ratios – Term Loan Working capital - Short term funds are not diverted to finance long term assets. - Availability of raw material, power and labour.
FINANCIAL RATIOS AND PARAMETERS LONG TERM VIABILITY PROFITABILITY • Gross profit to sales • Operating profit to sales • Net profit to sales • Cash accruals • DSCR – Debt service coverage ratio • Break even Analysis • Sensitivity Analysis • Internal rate of return BALANCE SHEET • Current ratio • TOL to Tangible Net worth • Term Liability to Tangible Net worth SHORT TERM VIABILITY PROFITABILITY • Gross profit to sales • Net profit to sales • Raw Materials to sales • Interest to sales • Interest Coverage ratio BALANCE SHEET • Current ratio • Total Outside Liability to Tangible net worth • Term Liability to Tangible net worth • Stock turnover ratio • Receivable Turnover ratio
Implication of each ratios • Current ratios Current assets are sufficient to service current liabilities 1.33:1. • TOL to TNW Total outside liabilities against tangible net worth are not out of proportion – Maximum 3 to 4 times • DSCR Cash accruals are sufficient to service interest on Term Loan and Term Loan – Minimum 1.75 times • Break Even Analysis Capacity utilisation & Turnover at a level where both variable and fixed expenses are absorbed – No profit – No loss. • Sensitivity Analysis Profitability level, cash accruals and DSCR • i) At a level when sales price is lower in actual than assumed. • ii) At a level when raw material price is higher in actual than assumed. • iii) At a level when production is lower in actual than assumed. • Interest coverage ratio Profit before interest divided by interest. How many times, profit covers interest • 7) Stock & receivable How many time stocks and Receivables are routed • Turnover ratio against assumed sales
Project Viability • PROMOTERS’ Point of view • Proper use of technology • Monitoring Cost control • Technical Skilled Manpower • Appropriate process flow-control – Reduce wastages • Financial discipline – Judicious use of finance • Inventory control • Marketing – Keep check on competition – Domestic / Global • BANKERS – institution point of view • SHORT TERM • Control on Receivables – Current assets • No diversion of working capital for long term assets • Proper implementation of process flow chart • Production planning • LONG TERM • Cash accruals as planned to service debt • Proper knowledge on sensitivity • Break – even planning
Control of stock in process Yarn production cycle – 7 days
Selection of Product Mix The product mix depends upon various factors. • Promoters’ Competency – experience – Market knowledge • Proper market survey – Marketing network • The selection of Machineries based on proposed product mix Whether carded yarn only carded and combed yarn • Financial Resourcefulness • Technical Manpower • Availability of Raw material
Case Study – Textiles – Spinning TEXTILE - VALUE CHAIN
Manufacturing Process Man made Filament Man-made Staple fibers Natural Fibers (Cotton) Fiber Cleaning Blending Texturizing Carding Drawing Combing Drawing Drafting - inter Spinning Winding
Technical Parameters LENGTH
Co-relation between fiber and yarn. • Staple length spinning potential • Fiber strength Yarn strength, less breakages • Fineness Finer spinning potential • Maturity Yarn strength and evenness, better dyeing absorbity • Trash (non-lint content) Reduce waste • Uniformity Ratio Better productivity and evenness • Elongations less end breakages • Friction cohesiveness • Yellowness Yarn appearance • Nepiness Yarn nepiness • Moisture Content 8.5% moisture content optimum for spinning @ 65%.
Production Calculation 7.22 x rpm TPI = T.M X √Count TPI X Count 4.1 x 4.4722 = 18.335 1) 20s Carded 7.22 x 1350097470 = 265.803 gms per spindles shift 18.335 x 20 367 4.1 x 4.899 = 20.086 2) 24s Carded 7.22 x 15000108300 = 224.659 gms per spindles shift 20.086 x 24 482 4.1 x 5.477 = 22.456 3) 30s Carded 7.22 x 17000122740 = 182.193 gms per spindles shift 22.456 x 30 674 4.1 x 6.324 = 25.931 4) 40s Carded 7.22 x 17000122740 = 118.333 gms per spindles shift 25.931 x 40 1037
PRODUCTION AT EACH STAGE – RAW MATERIAL REQUIREMENT Capacity Utilisation – 97% efficiency 94% Yarn Production – Ring Frame – 9457 Kgs per day Yarn Production – Autoconor – 9362 Kgs per day – Final product for sale RAW MATERIAL REQUIRED PER DAY 10871 KGS.
Thank You.. PKM Advisory Services Pvt. Ltd. A-411-412, Safal Pegasus, Nr. Prahalad Nagar Garden, 100 Ft Road, Anand Nagar Road, Prahaladnagar, Ahmedabad - 380054 Phone no : +91-79-40065204 Fax: +91-79-40067203Email: info@pkmadvisory.com Web: www.pkmadvisory.com