Download
1 / 19
200 likes | 269 Views
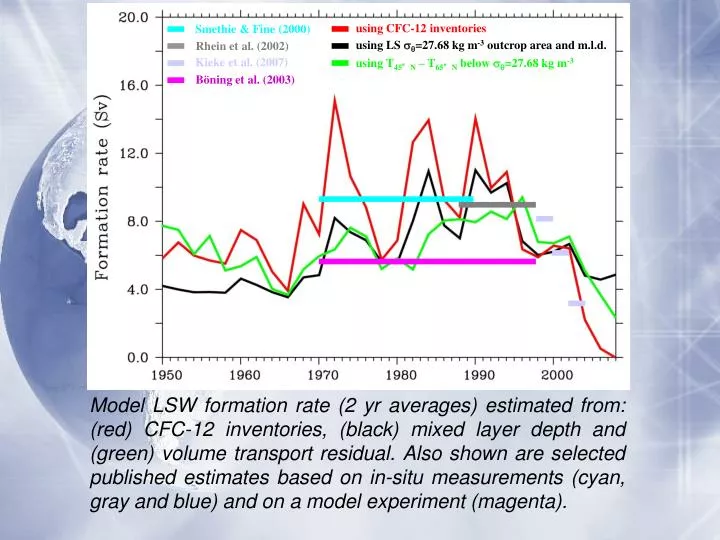
using CFC-12 inventories. Smethie & Fine (2000). using LS =27.68 kg m -3 outcrop area and m.l.d. Rhein et al. (2002). Kieke et al. (2007). using T 45°N – T 65 ° N below =27.68 kg m -3. Böning et al. (2003).

E N D
using CFC-12 inventories Smethie & Fine (2000) using LS =27.68 kg m-3 outcrop area and m.l.d. Rhein et al. (2002) Kieke et al. (2007) using T45°N – T65°N below =27.68 kg m-3 Böning et al. (2003) Model LSW formation rate (2 yr averages) estimated from: (red) CFC-12 inventories, (black) mixed layer depth and (green) volume transport residual. Also shown are selected published estimates based on in-situ measurements (cyan, gray and blue) and on a model experiment (magenta).
Deep water formation, the strength of the subpolar gyre, and the AMOC in the subpolar NA Monika Rhein, IUP, Universität Bremen www.ocean.uni-bremen.de mrhein@physik.uni-bremen.de
Does the observed changes affect the MOC ? • What is the meridional heat and volume transport in the subpolar North Atlantic ? • What role plays the interior transport versus boundary current transport?
B15 B14 B13 B12 Moorings (red) and PIES (yellow), PIES B12-B15 deployed Aug. 2006, data received August 2008, continued at least to 2012
Meridional heat and volume transport across 47°N What signal is to be expected ?
Effect of variable thermohaline forcing in isolation ORCA-HEAT+FW: climatological wind stress; interannual heat and fw fluxes Labrador Sea Water formation (Sv) MOC anomalies (C.I.= 0.5 Sv) NAO+ 8 Sv 0 • - Positive MOC anomalies follow periods of intensified LSW formation • - Amplitude of decadal MOC variability: ~ 2 Sv at 45°N Böning and Biastoch, 2008
Superposition of wind-driven MOC anomalies 3 Sv 0 -3 ORCA cases: HEAT+FW REF WIND Böning and Biastoch, 2008
Strength of MOC dependent on density of Overflows Observed density decrease during the last 4 decades (due to freshening) Latif et al., 2006
Correlation volume and heat transport (ORCA 0.5°) black: based on monthly, red: based on 2-yr-filtered time series Böning and Biastoch, 2008
MOC strength at 43°N between 13 and 21 Sv • Results strongly dependent on constraints used in inverse models • Relation between MOC, deep water formation and subpolar gyre strength ? • Time series of mass AND heat transport needed ! Expected annual variability : 2 - 3 Sv ? • in subpolar North Atlantic , mass and heat flow not correlated ? • Measure annual mean volume and heat transport with uncertainty < +/- 10 %.
Boundary current array,. Background: meridional velocity from LADCP (August 2008). Black lines: isopycnals Will be deployed in 2009 - 2010
Time series of the meridional mass and heat transport: Separate velocity field V in Vrel : geostrophic velocity relative to reference level Vfluc : geostrophic velocity fluctuations at the reference level Vmean : mean velocity in the reference level Objective: measure directly the mean velocity at the reference level
Geostrophic velocity relative to reference level from travel time of C-PIES Reference level: depth of moored C-PIES The geostrophic fluctuations at the reference level: calculate from pressure fluctuations p‘ measured by C-PIES -- mean pressure cannot be used: unknown drift,...
Mean velocity at the reference level directly measured by current meter attached to the C-PIES (located above the bottom boundary layer) Horizontal resolution must be sufficient to resolve mean velocity field
Meridional velocity at 47°N from sc-ADCP data, 2005 N/O THALASSA C. Mertens
Meridional velocity at 47°N annual mean 1996-2004 1/12° FLAME model S. Hüttl, C. Böning
Rossby Radius of deformation : 20 km Observed horizontal scales of NAC eddies and meanders : 100 km Mean horizontal distance between the C-PIES: 70-90 km 30 C-PIES are needed