Download
1 / 7
70 likes | 207 Views
As a relatively water rich state, MA is exposed to periodic droughts Heterogeneous both in space and time; Often coinciding with local storm floods, sometimes at same location; The most significant ’29-’32 & ’61-’69 episodes may be used as analogue for the most recent ’00-’02 droughts.

E N D
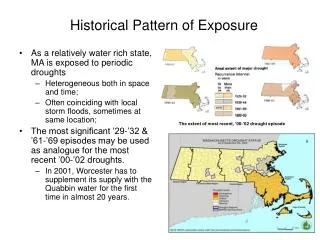
As a relatively water rich state, MA is exposed to periodic droughts Heterogeneous both in space and time; Often coinciding with local storm floods, sometimes at same location; The most significant ’29-’32 & ’61-’69 episodes may be used as analogue for the most recent ’00-’02 droughts. In 2001, Worcester has to supplement its supply with the Quabbin water for the first time in almost 20 years. Historical Pattern of Exposure The extent of most recent, ’00-’02 drought episode
Community water bans as proxy indicator of severity of ’00-02
Massachusetts Drought Summary Percent of time spent in drought categories -- NOAA Climate Data Center/Central Climate Division (corresponding roughly to Central Massachusetts-- Based on the monthly Palmer Drought Severity Index as computed by the National Climatic Data Center. "Cumulative" is the percent of time in given category plus all preceding categories.
Coastal orientation: prone to land-ocean-air thermal contrasts Mid-Latitude: prone to solar forcing, teleconnections (with NAO) Interacting effects that add to variability Position in the zone of westerlies: prone to opposing air masses from all corners Changing elevations: effect of mountain ranges Progression of drought:: metrological drought hydrological drought Land-consuming patterns of development: change of surface albido; effects of urban heat islands on local climate; Large forest coverage (from secondary growth) serving as water sponge Precipitation variability (amount, intensity, timing) High summertime heat waves, high winds, greater sunshine, low humidity, less cloud cover, etc. Unplanned growth: spatial mismatch between water supplies and uses; Shortfall Surfeit Frequent interaction with flood hazards not only complicate impacts, but also tend to increase the uncertainty and difficult for adaptive behaviors at all levels. Floods Reduced infiltration, runoff, deep percolation and aquifer recharge Increased evaporation and transpiration Population growth & wealth effects: increasing water consumption; increasing waste disposal; Critical threshold of vulnerability. Agricultural decline: reduced economic dependency on water Interacting impacts Soil water deficiency Reduced streamflow, inflow to reservoirs, lakes, and ponds; reduced wetlands Plant water stress, reduced biomass and yield (such as timber and horticulture harvests) Well-developed water supply infrastructure (the Quabbin & the Wachusett Res. Environmental: -Increased water quality & public health concerns; -Heightened risks of wildfire; -Fish kills and displacement of certain populations of animals ; -Damages to wildlife habitats; Economic: -Potential of reduced timber and horticultural harvests; -Potential of decreased hydropower production; -More limited opportunities for land development; -And so forth. Social: -More likelihood for water conflicts; -Reduced daily conveniences due to water ban; -Reduced water available for fire suppression; -Tax implications for infrastructural maintenance; -And more. Mechanism, Web of Impacts, Exacerbating & Mitigating Factors Turbulent climate & weather in Massachusetts
Current Conditions Report Jointly responsible by EOEA & MEMA • Information collection • Consistent basis for evaluation • Clear lines of communication • Policy recommendations Communicate to target audiences Regionally-based Action Levels --Six “drought regions,” defined in terms of population, density, water demand, topography, and runoff characteristics. --Staged responses formulated on a regional basis. • Ground/surface water levels & streamflow conditions • Forecast & historical comparisons • Precipitation • Status of water restrictions in communities • Water quality & public health concerns • Reservoir levels • Status of water supplies • Forest fire conditions • Crop/soil/agriculture conditions • Public utility issues • Status of USACE water resources • Drought indices • Impacts to ecosystems, flora, and fauna Emerging Drought Coping Regime in MA USGS State Governor National Weather Services Emergency Management Administration (MEMA) Water Resources Council (WRC) US EPA The State Drought Management Task Force (DMTF) US Army Corp of Engineers Water Supply Citizens Advisory Committee. Executive Office of Environmental Affairs (EOEA) US Depart of Agriculture US Depart of Agriculture Department of Environmental Protection (DEP) Federal Emergency Management Agency (FEMA) Massachusetts Association of Health Boards Department of Environmental Management (DEM) Northeastern Emergency SEC Municipal government Department of Food & Agriculture (DFA) Local Boards of Health Massachusetts Water Works Association Local Fire Departments Department of Public Health (DPH) Public Water Suppliers Foresters Massachusetts Department of Fish, Wildlife & Environmental Enforcement (DFWELE) Farmers Large Water Users (industrial, commercial, etc.) Metropolitan District Commission (MDC) MWRA Community Water Suppliers Massachusetts Water Resources Authority (MWRA)
Where will the new water come from and what shall we do NOW? While the impacts of climate change on water supply are not certain, the anthropogenic stresses are, as the build-out analysis illustrates…