Download
1 / 77
770 likes | 865 Views
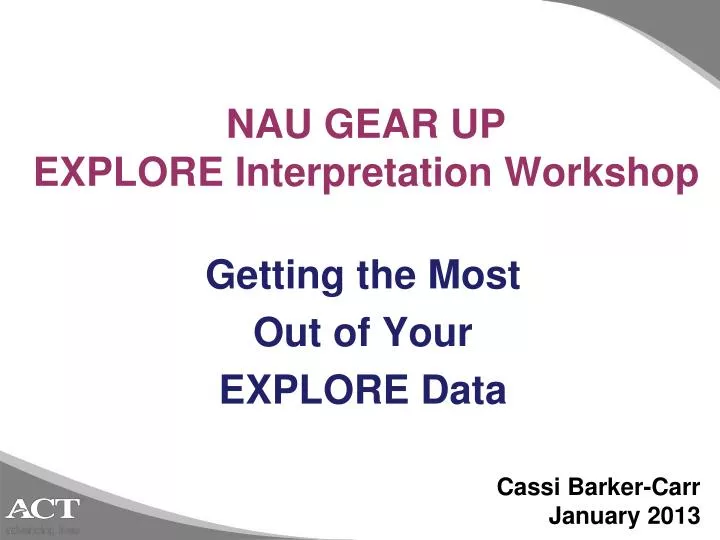
NAU GEAR UP EXPLORE Interpretation Workshop . Getting the Most Out of Your EXPLORE Data. Cassi Barker-Carr January 2013. Workshop Objectives. Learn how to maximize interpretation of your data Find out what your data is telling you Create an communication/action plan.

E N D
NAU GEAR UPEXPLORE Interpretation Workshop Getting the Most Out of Your EXPLORE Data Cassi Barker-Carr January 2013
Workshop Objectives Learn how to maximize interpretation of your data Find out what your data is telling you Create an communication/action plan
ACT National Curriculum Survey® • Determines what skills and knowledge postsecondary institutions expect • Measures college-ready skills • Surveys completed nationally • Consultation with content area experts
Longitudinal AssessmentsCollege Readiness System Scores 36 32 25
IMPROVING COURSE RIGOR MEASURING STUDENT PROGRESS TOWARD READINESS EXPLORE 8th and 9th grade curriculum-based educational and career planning program The ACT 11th and 12th grade curriculum-based assessment for learning outcomes ENGAGE Middle and high school assessment that measures all factors of academic success PLAN 10th grade curriculum-based educational and career planning program QualityCore Research-driven solutions for strengthening curriculum SUPPORTING SOLUTIONSPLANNING SCHOOL IMPROVEMENT Core Practice Audit Framework for evaluating current practices CoreWork Diagnostics Online service to diagnose and improve content and practice areas EXPLORE Designed to help 8th and 9th graders explore a broad range of options for their future, EXPLORE is a curriculum-based educational and career planning program that measures achievement in English, math, reading, and science. As an early indicator of college readiness, EXPLORE gives educators the means to structure high school planning and career exploration for students and parents.
EXPLORE • Grades 8 and 9 • English, Mathematics, Reading, and Science • Total time for tests: 2 hours • Needs Assessment • Plans and Background Information • UNIACT Interest Inventory
Communication Defined • Exchange or sharing of information to all people involved in the stages of implementation
Why Important • Help prevent poor performance by planning ahead • Ensures action is taken • Avoid assumptions • Increase stakeholder buy-in
Students Need to Know • Purpose, significance, what is being measured, how they can use the results in planning their high school career and how the school will use the assessment results
Parent/Guardian Needs to Know • Purpose, significance, what is being measured and how the school will use the assessment results
Educators Need to Know • Purpose, significance, what is being measured • How the results can be used • Teaching and guiding individual students • Curricular improvement • Instructional improvement
Student Score Report • An individualized score report detailing scores received on the assessment, career plans and needs indicated by the student.
Student Score Report • The Student Score Report will provide: • suggestions for improving student academic skills • careers that match student interests • indicators of college readiness
Student Score Report Student’s Grade Level Scan Date Student’s School School EXPLORE® Code Test Date
Student Score Report • Questions to Consider: • What can norms tell you about this student? • How does this student compare with other students nationally?
Student Score Report • Help interpret what the scores earned in EXPLORE, PLAN, and the ACT mean • Identify the knowledge and skills students are likely to demonstrate at various score levels on each academic test
Student Score Report • Questions to Consider: • How can your school meet the needs of what the student is asking for? • Are you already addressing these?
Student Score Report • Question to Consider: • How does the student’s courses and scores relate to their educational plans and career choices?
Student Score Report • Questions to Consider: • Is the student on track to be college and career ready? • What course of action can be taken with the student to increase their college readiness? • Where does the student need intervention to get on track?
ACT’s College Readiness Benchmarks Empirically derived 50% chance of achieving a B or higher or about a 75% chance of achieving a C or higher in the corresponding credit-bearing college course EXPLORE
ACT’s College Readiness Standards Direct link between what students have learned and what they are ready to learn next. • Help interpret what the scores earned in EXPLORE®, PLAN® and the ACT® mean • Identify the knowledge and skills students are likely to demonstrate at various score levels on each academic test
College Readiness Standards Mathematics Statements that describe what students are likely to know and be able to do... And statements that provide suggestions to progress to a higher level of achievement
Student Score Report You and the World of Work Exploring Career Options Your Interests
Student Score Report www.explorestudent.org
Profile Summary Report What is the Profile Summary Report (PSR)? • summarizes the performance of your students • available at the school and district level
Profile Summary Report • compare your students’ score and subscores with those of students nationally • measure if your students are On Track to be college ready when they graduate from high school • differentiate scores by ethnic and gender groups • show how our students respond to the local items
Profile Summary Report • relate student composite scores and coursework plans: • to their educational plans • to their expressed needs for help • postsecondary plans to their career preferences from the Career Areas List. • postsecondary plans relate to their career clusters from the World-of-Work Map.
Profile Summary ReportTable 1c –Questions to Consider • How does your local ‘% At or Above Benchmark’ in each content area compare to the national %? • In which ranges are the majority of your students? • Given these score ranges, in which College Readiness Standards are your students most proficient?