Download
1 / 109
1.09k likes | 1.1k Views
Introduction to Map and Compass. SHSM Certificate. Introduction to Map and Compass. This tutorial consists of four parts. The objective is to provide you with a basic understanding of the map and compass as used for navigation on land. There is a short quiz at the end of each part.

E N D
Introduction to Map and Compass SHSM Certificate
Introduction to Map and Compass This tutorial consists of four parts. The objective is to provide you with a basic understanding of the map and compass as used for navigation on land. There is a short quiz at the end of each part. Part 1: Globe to Map – Round to Flat Part 2: Topographic Maps Part 3: The Magnetic Compass Part 4: Navigation
Introduction to Map and Compass Part 1: Globe to Map – Round to Flat
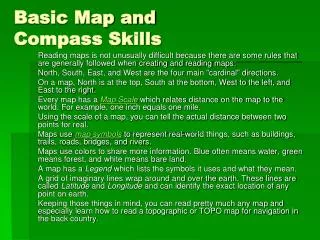
Globe to Map – Round to Flat Projection Our planet is generally spherical. Maps are flat. Have you ever tried to remove an orange peel in one piece? What happens if you try to flatten it? You end up with large gaps and tears. That’s what happens when you try to make a flat map of a round earth….the process is called PROJECTION.
Globe to Map – Round to Flat Projection There are dozens of different PROJECTIONS that try to solve the problems of going from round to flat. All maps are distorted in some aspect. Four things that become distorted are: area, shape, direction, and distance.
Globe to Map – Round to Flat Projection If you place a light source inside a transparent globe, and mark where areas of land appear on a flat screen, you are PROJECTING In reality, this is done mathematically rather than using light and screens, but the principles are the same. Notice how things at the centre are much less distorted than things at the edges. This is a major problem for navigation!
Globe to Map – Round to Flat Projection Notice how the size and area of Greenland are distorted in this PROJECTION. But notice how the shape is very similar to the globe. What we need for navigation on land is a map that will preserve shapes, distances and directions…
Globe to Map – Round to Flat Projection Imagine that you could wrap a sheet of paper around the earth. If you think about it, the paper is only touching the surface along a single line. That line becomes the CENTRAL MERIDIAN of your map. Everything touching that line can be accurately transferred to the paper. The farther you move away from the line, the more distorted things get.
Globe to Map – Round to Flat Projection Stops at ~80°North Latitude Central Meridian 6° of longitude Stops at ~80°South Latitude This method gives you a map that is accurate to about 3° east and west of the CENTRAL MERIDIAN, making it about 6° of longitude wide.
Globe to Map – Round to Flat Projection By using a series of meridians 6° apart, it is possible to project an accurate map of the entire surface of the earth.
Globe to Map – Round to Flat Projection Maps are named for the projection technique used. These maps are therefore known as UNIVERSAL TRANSVERSE MERCATOR or “UTM” maps. There are 60 UTM zones, each 6° wide… adding up to…360°…get it? Each numbered zone is broken into smaller parts identified by letters…we happen to be in Zone 17T
Globe to Map – Round to Flat Projection A rectangular grid is overlaid on the maps in order to provide accurate location information. You will learn to use this later in the lesson. The map’s actual ORIGIN (starting point) is where the Equator and the CENTRAL MERIDIAN meet. But… Equator Map Origin Central Meridian
Globe to Map – Round to Flat Projection To make the numbering system make more sense, it actually begins at the FALSE ORIGIN. Notice that the blue grid does not align perfectly with the lines of longitude. You’ll learn more about “North” later. Equator “False” Origin Map Origin Central Meridian
Map makers simplify the real world to make maps easier to read. They decide what gets left out and what gets added, depending on the map and its intended use. Reality is way too detailed to include it all! Globe to Map – Round to FlatGeneralization and Simplification
Individual trees become areas of green. Rivers can be reduced to a line. Roads can be thicker than they really are and the curves are simplified. Globe to Map – Round to FlatGeneralization and Simplification
Globe to Map – Round to FlatGeneralization and Simplification Notice how large buildings become simple black outlines. Also notice that not all buildings are shown. One reason for this is to simplify the map. Another is that buildings may have ben built since the map was created. The world changes, the map does not! That’s why you should always check the date of publication of a map you are using!
Globe to Map – Round to FlatGeneralization and Simplification More examples of GENERALIZATION. Notice that although a large amount of detail is left off of the map, it still provides a very accurate idea about the land it shows.
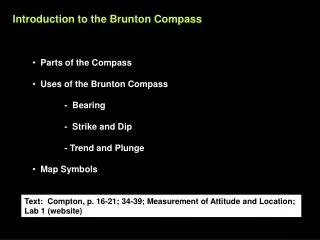
Globe to Map – Round to Flat Common Symbols You Should Know Com Communication Tower (Usually easy to spot due to height) Buildings (Small buildings are less detailed) School Tank or Silo Benchmark with Elevation (Surveyed point with known elevation) Church 352.4
Globe to Map – Round to Flat Common Symbols You Should Know Track (a foot path) Bridge (can be highway or railway) Road-Loose Surface (a gravel road) Single Track Railway Road-Hard Surface (a paved road) Transmission Lines (steel towers or poles)
Globe to Map – Round to Flat Common Symbols You Should Know River/Stream Built up Area (village/town/city) Pond/Lake Orchard Intermittent Pond/Lake (it may or may not be there… depends on the season.) Wooded Area Swamp/Marsh
Introduction to Map and Compass End of Part 1 Do QUIZ 1 now.
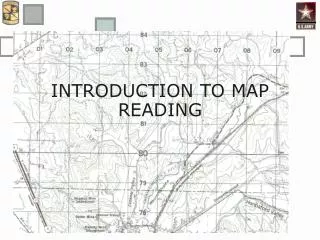
Introduction to Map and Compass Part 2: Topographic Maps
Topographic Maps The map most frequently used for land navigation in Canada is the 1:50,000 scale UTM map produced by Natural Resources Canada (NRCan). The “Norths” Its main features are labeled in this diagram. You will learn about each of them in the next set of slides. UTM Zone Index to Adjoining Maps Map Name Datum Conversions Scales UTM Grid Contour Interval and Map Datum
Topographic Maps The “Norths” This is the way that NORTH is shown on Canadian topographic maps. It displays TRUE NORTH , MAGNETIC NORTH and a third North. Recall that that the blue grid does not align perfectly with the lines of longitude. This is where we get the third “North”, known as GRID NORTH. When using these maps, it is best to navigate using GRID NORTH.
Topographic Maps UTM Zone It is important to know what UTM Zone you are working in, especially if you are also using GPS to assist in your navigation. This map is found in Zone 17T.
Topographic Maps Map Name Canadian topographic maps are generally named for the major feature (natural or man made) near the centre of the map sheet. This does not mean that the entire feature will appear on the map; you may need to acquire adjoining sheets. On this map, the city of Cambridge, Ontario is found near the centre of the map.
Topographic Maps Map Index On the right side of the map you will find the “Index to adjoining Maps of the National Topographic System” Its pretty simple. The map you have is the one in the centre (40 P/8). If you want to travel to Brantford, you need to get the map sheet to the south (40 P/1)
Topographic Maps Map Datum Contrary to what you may have been taught, the earth is not a sphere. Its actually more pear shaped…and its lumpy. Actual shape of earth
Topographic Maps Map Datum To make maps fit together, cartographers use a DATUM as a common reference. The DATUM is a “smoothed out” version of the real earth. DATUMS are named according to date or location of origin. Actual shape of earth North American Datum 1927 (Green) North American Datum is usually written as NAD. The number after it is the year…so…NAD27
Topographic Maps Map Datum But…a DATUM can change as new technology appears and makes them more accurate. You should be aware of the DATUM that was used to create the map you are navigating with. Actual shape of earth North American Datum 1927 (Green) NAD27 North American Datum 1983 (Red) NAD83
Topographic Maps Map Datum The DATUM is listed along the bottom of the map, usually along with the information about CONTOUR INTERVAL This map was created using the North American Datum 1983 or NAD83
Topographic Maps Datum Conversions Earlier maps in this series were produced using NAD27. Now they are all NAD83, BUT… there are still a lot of sources using older maps. Since the DATUM changes the shape, some things are displaced on the two versions of the same map. The DATUM CONVERSION chart tells you how much difference there is, and how to make adjustments. This is usually not a problem when using a compass, but if you also use GPS it is CRITICAL to use the correct DATUM.
Topographic Maps Contours One of the most valuable aspects of the TOPOGRAPHIC MAP is its ability to convey information about the shape of the land. It shows the shape by using CONTOURS You may recall from Grade 9 Geography that a CONTOUR is a line that joins points with the same elevation. If you walk ALONG a CONTOUR LINE you stay at the same elevation. If you walk ACROSS a CONTOUR LINE you either go up or down. In the next few slides you will learn to tell the difference!
Topographic Maps Contours Imagine that we are looking at a small hill, from the side. We also know what it looks like from above.
Topographic Maps Contours Every point on this line is 150m asl Now we divide the hill into horizontal slices. In this case each slice is 10 m thick. They are assigned heights ABOVE SEA LEVEL or asl The base of this hill is 150m asl. The peak is just over 200 m asl.
Topographic Maps Contours Every point on this line is 160m asl The elevations are transferred to the map and CONTOUR LINES are produced for every 10 m change in elevation.
Topographic Maps Contours The result is a familiar set of nested lines that show the shape of the hill.
150 100 Topographic Maps Contours To make it easier to follow complex CONTOUR LINES, every fifth line is bolded and has its value printed along it. These are called INDEX CONTOURS.
150 100 Topographic Maps Contours B The closer the CONTOUR LINES are, the steeper the slope is. The path to “B” is less steep than the path to “A”. A
Topographic Maps Determining Straight Line Distance A In order to find the STRAIGHT LINE distance from “A” to “B” you will need a pencil and a piece of paper. B
Topographic Maps Determining Straight Line Distance A Put the edge of the paper over the map so that it passes through both points. Mark the two points on the paper. B
Topographic Maps Determining Straight Line Distance A Put the paper along the appropriate scale on the map and determine the distance between the marks. In this example, 1km (to the right of the “0”) and 700 m to the left, for a total of 1700 m. B
Topographic Maps Determining Distance Along a Curve A Finding distances along curves is more complicated, but still easy. Put the edge of the paper over the map so that it aligns with the first segment of the road. Mark the start point on the paper. B
Topographic Maps Determining Distance Along a Curve A Now mark the furthest point along the edge where it still touches the road. Keep the pencil point pressed against the page and rotate the paper around it… B
Topographic Maps Determining Distance Along a Curve A Mark the next point, then repeat the procedure. B
Topographic Maps Determining Distance Along a Curve A Keep going, turning the paper to align with the road, marking each point as you go. B
Topographic Maps Determining Distance Along a Curve A …and again… B
Topographic Maps Determining Distance Along a Curve A …and again… B
Topographic Maps Determining Distance Along a Curve A …and again… B
Topographic Maps Determining Distance Along a Curve A …and again. B