Download
1 / 16
160 likes | 276 Views
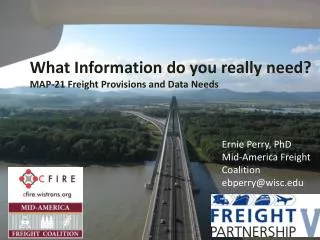
MAP-21 Freight Provisions and Data Needs. D oes understanding the big picture matter?. Will imports/exports go up or down in 10 years? Where will people live in ten/twenty/thirty years? Where will the state see more truck traffic? Will modal shares change?

E N D
Does understanding the big picture matter? • Will imports/exports go up or down in 10 years? • Where will people live in ten/twenty/thirty years? • Where will the state see more truck traffic? • Will modal shares change? • What if the State attracts more manufacturing? • Truck parking issues? • What is my neighbor doing? • What will this change and where?
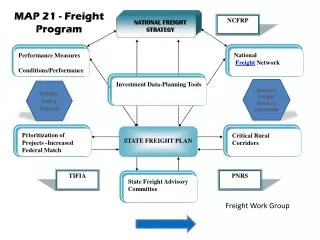
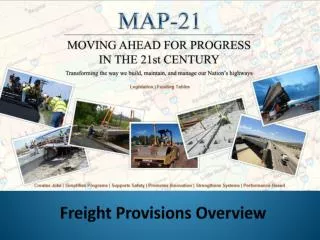
MAP-21 Freight Responsibilities State Actions Federal Actions Establishment of a National Freight Network Critical Rural Freight Corridors National Freight Strategic Plan Data programs Develop conditions and performance • Sec 1118 • Trends, needs and issues • Policies, strategies, performance measures • Cost Sharing Formulas
National Freight Network • Primary freight network • Designated within one year • Based on inventory of freight volume • 27,000 centerline miles, existing roadways • 3,000 additional miles possible • Redesignation every 10 years • Other portions of the Interstate System • Critical rural freight corridors.
Planning for Freight All Modes All cargos Discretionary routing
The Ideal Database? (Based on TRB Reports) • Time (date) associated with the shipment movement itself; • Mode (truck, rail, water) and submode; • Product origin and destination, including international shipments; • Facility or equipment interchanges, including intermodalism; • Type of equipment used to move the product; • Product weight, density (measured in pounds per cubic foot) and value; • Shipment size; • Route used for domestic shipments. • Shipper and receiver relationship (contractual); • Transportation rates, fees, and costs; • Time sensitivity (just in time, JIT) or perishablity of the product; • Equipment movements, including repositioning empties and backhauls; • Other products moving on the same piece of equipment (multiple products from either the same or different shippers); • The economic multipliers associated with the shipment (tied to other modeling efforts); • Cargo ownership, including the names and addresses of the shipper, receiver, and carriage provider; • Tax and fuel payments tied to shipment; • The relationship between goods movement to the economy and jobs; • Timely data collection and reporting of the shipment event to others (the information is reported fairly quickly after the shipment occurred); • Identifying the actual product that was shipped?
How much do you need regarding freight data and analysis? • Enough to get buy in • Enough to tell the story • Enough to demonstrate consideration
States can partner to identify/meet strategic needs • A way to share information on system use and traffic • Network data, regional trends, performance measures • A mechanism to work with regional agencies • Common message – generates common actions • An input into State planning • Data and economics • Freight Advisory Group agreement • Improved access to data and models • A benchmark for collaborating federal requests
One Conclusion… Our economy depends upon freight – tell the story… Freight does not recognize political boundaries but markets and infrastructure Is federal policy moving to support efficiency, not equity, to fund competitive grants? Collaboration may demonstrate value to decision makers What you do matters…
Thank you Bruce Lambert Executive Director Institute for Trade and Transportation Studies 540-455-9882 bruce@ittsresearch.org • Visitittsresearch.org for more information about: • Newsletter • State Statistics • Reports and Presentations