Download
1 / 55
550 likes | 560 Views
WATER WARS. 12% of population uses 85% of water. Zoltan Grossman The Evergreen State College http://academic.evergreen.edu/g/grossmaz. Sources of water. Surface fresh water: 3% of liquid water, which is 13% of fresh water, which is 2.4% of water. Precipitation Patterns.

E N D
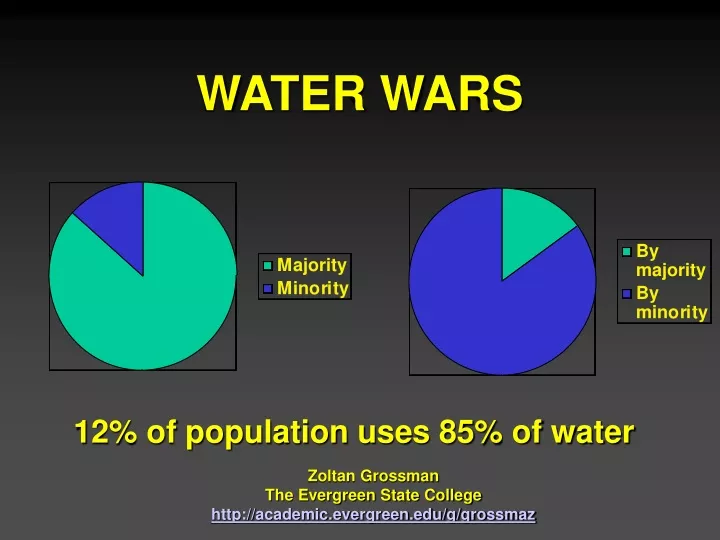
WATER WARS 12% of population uses 85% of water Zoltan Grossman The Evergreen State College http://academic.evergreen.edu/g/grossmaz
Sources of water Surface fresh water: 3% of liquid water, which is 13% of fresh water, which is 2.4% of water
U.S. Water Policy • Through most of US history, water policies have generally worked against conservation. • In well-watered eastern states, water policy was based on riparian use rights. • In drier western regions where water is often a limiting resource, water law is based primarily on prior appropriation rights. • Fosters “Use it or Lose it” policies.
Ogallala Aquifer High- capacity well withdrawals
Western U.S. water conflicts Klamath Basin, Oregon vs. Farmers. Ranchers. “Wise Users” Commercial fishers, Sport fishers, Tribes, Environmentalists
Bulk water transfers River system diversions(Canada-to-U.S.)Water pipelines(Canada/Great Lakes-to-Southwest)Supertankers(North America-to-Asia)Canadian government banned bulk transfers in 1999.
WATER AVAILABILITY AND USE • Renewable Water Supplies • Made up of surface runoff and infiltration into accessible freshwater aquifers. • Readily accessible, renewable supplies are 400,000 gal/person/year.
Depleting Groundwater • Groundwater is the source of nearly 40% of fresh water in the U.S. • On a local level, withdrawing water faster than it can be replenished leads to a cone of depression in the water table, • On a broader scale, heavy pumping can deplete an aquifer. • Mining non-renewable resource.
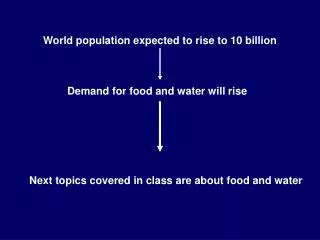
FRESHWATER SHORTAGES • Estimated 1.5 billion people lack access to an adequate supply of drinking water. • Nearly 3 billion lack acceptable sanitation. • Freshwater withdrawals doubled in 50 yrs. • A country where consumption exceeds more than 20% of available, renewable supply is considered vulnerable to water stress.
A Precious Resource • 45 countries have serious water stress, and cannot meet the minimum essential water requirements of their citizens. • More than two-thirds of world’s households have to retrieve water from outside the home.
PRIVATIZATION • Price mechanisms charging a higher proportion of real costs to users of public water projects has helped encourage conservation. • Yet discriminates against poor.
Global water Industry Over $140 Billion a year The World Water and Wastewater Utilities Market is estimated at $142 billion US in 2000… (2000, $US)
“Water War” in Bolivia Cochabamba residents protesting Bechtel privatization of municipal water system, 1999
Private and public: subsidies to and from water Private Public Subsidies from taxation Loss leaders Water services Financing other MNC operations Financing other public services
Alternative: Porto Alegre, Brazil Autonomous department • Efficiency and public accountability • ‘Participatory budgeting’ • Decentralised democratic prioritizing
Alternative: Debrecen, Hungary • Preferred public to private • Cheaper • Financial comparison
Safety of municipal water supplies Australia, 1998 (privatized system) Wisconsin, 1993 Ontario, 2000 (gov’t had dropped e-coli testing)
BOTTLED WATER costs more than oil
Water Privatization Woodstock Riot 1999 Fewer bubblers in public buildings?
Perrier/Nestle in the U.S. Texas Florida
Perrier/Nestle in the Midwest Wisconsin Michigan Alliance of farmers, sportfishers, tribe, environmentalists prevents Perrier from pumping springs, 1999-2002 Protection of rural supplies from high- capacity wells
“NEW GEOGRAPHY OF CONFLICT” “Possible flashpoint for resource conflict” Water systems & aquifers • Jordan • Nile • Tigris – Euphrates • Amu Darya • Indus • Mountain Aquifer (West Bank/Israel)”
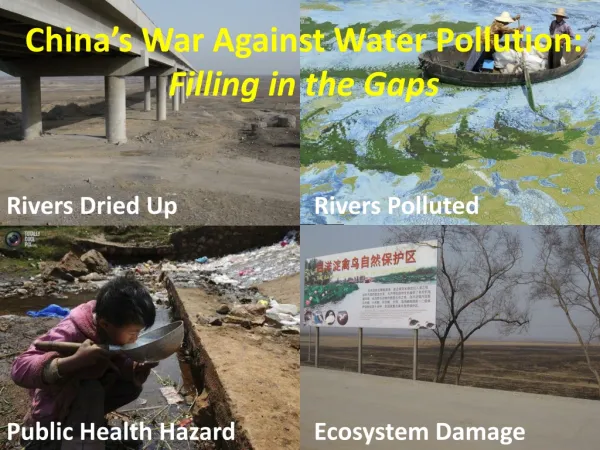
Water diversions from rivers Yellow River (Huang He) In northern China Colorado River Delta in U.S./Mexico
Soviet diversion of rivers to the Aral Sea • Once the 4th largest inland body of water in the world A series of dams was built to irrigate cotton. • Aral Sea reduced to about 25% of its 1960 volume, quadrupled the salinity of the lake and wiped out the fishery. Pollutants became airborne as dust, causing significant local health problems. • The environmental damage caused has been estimated at $1.25 -$2.5 billion a year.
Middle East Water Conflicts
Israeli- Palestinian Water Conflict Israel uses 82% Of West Bank groundwater; charges Arabs 3x
Israel’s boundary with Egypt and Gaza (Palestine)
Dead Sea Shrinkage
Tigris and Euphrates rivers Turkey Iraq
Major investments … 6 000 • 45,000 large dams • 2 dams commissioned per day in1970s • Total investment exceeds $2 trillion • flow in 60% of world’s rivers affected • 19% of world’s electricity from hydropower • Other dams for irrigation, flood control, water supply NUMBER OF DAMS 4 000 2 000 0 1900 1990s
Dam projects increasingly questioned • Affected populations strongly oppose dams • Proponents point to development demands • Opponents point to adverse impacts • Uprisings against globalization • Examples: Narmada (India), Three Gorges (China), Gabcikovo (Slovakia/Hungary)
Significant impacts on riverine & downstream ecosystems… • Sediment, salinity, and herbicide concentrations • Biodiversity losses • Fish migration, nutrient flows blocked • Evaporation in reservoirs • Reservoirs emit greenhouse gases • Flooding if dam fails • 67% of ecosystem changes in survey are negative