Download
1 / 33
330 likes | 462 Views
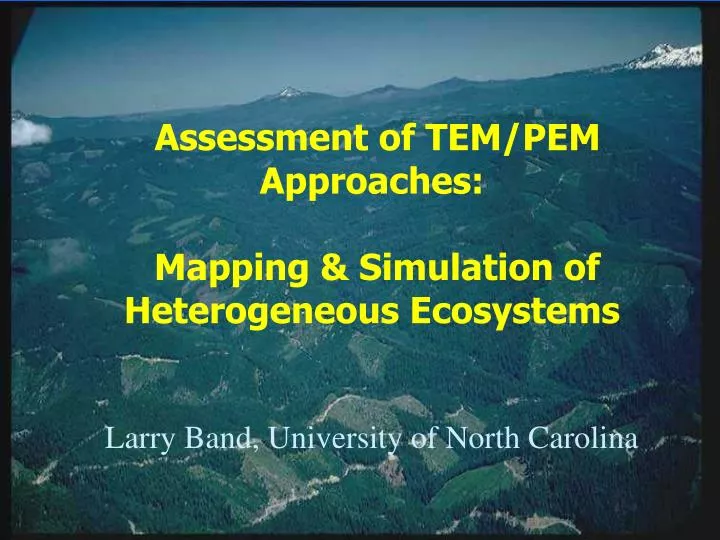
Mapping and simulation of heterogeneous ecosystems Larry Band, University of North Carolina. Assessment of TEM/PEM Approaches: Mapping & Simulation of Heterogeneous Ecosystems Larry Band, University of North Carolina. Presentation Outline.

E N D
Mapping and simulation of heterogeneous ecosystemsLarry Band, University of North Carolina Assessment of TEM/PEM Approaches: Mapping & Simulation of Heterogeneous EcosystemsLarry Band, University of North Carolina
Presentation Outline Mapping and simulation of heterogeneous ecosystemsLarry Band, University of North Carolina • Overview and assessment of TEM/PEM initiative: • Business plan drivers • Current spatial data models • Need for integrated assessment tools • Comparison with similar/related initiatives • Presentation of Hierarchical GIS/Ecosystem Models • Terrain analytic and remote sensing components • Integrated ecosystem, hydrology, climate modeling approach • Knowledge based, continuous inference schemes • Summary statements, recommendations for extending, implementing PEM initiative
Propositions to Consider Mapping and simulation of heterogeneous ecosystemsLarry Band, University of North Carolina • Drivers for PEM business case may be dynamic, at least in terms of priorities • paradigm shifts in natural resource management • Measurement and spatial analytical technologies are developing very rapidly • remote sensing, wireless monitoring, spatial information and modelling systems, knowledge acquisition and representation • Require flexible framework: extensible, interoperable with existing and developing IM technologies, needs • PEM is a model: subject to uncertainty of input data, processing - represent uncertainty in results
I. Overview and Assessment Mapping and simulation of heterogeneous ecosystemsLarry Band, University of North Carolina Process: Ecosystem carbon, water, nutrient cycling Watershed hydrology Disturbance Silvicultural operations • Drivers/Goals: • Timber Supply Inventory • Forest productivity • Carbon budgets • Biodiversity • Sustainable management • water supply, quality, flooding • fisheries • sedimentation • Silvicultural response Pattern: Geomorphic template Soils/substrate Topoclimate
Assessment of TEM Initiative • BC Biogeoclimatic classification system an excellent knowledge base for ecosystem mapping and ecoregionalization • most critical asset (ecosystem-landscape relations) well developed one of the best (possibly THE BEST) operational knowledge base available in the world • Data Model of TEM built on hierarchical cartographic framework of nested scale/minimum mapping area • Point-line-area (node-arc-polygon) model: discrete variation, hard boundaries • Manual TEM production time consuming, may lack reproducibility
Assessment of PEM Initiative • PEM provides reproducibility, greater production efficiency by automating/formalizing landscape model • opportunity tostandardize automated, self documenting BEC implementation • Currently designed to reproduce TEM data model • produces discrete regions as polygons or raster connected components • Ecosystem gradients represented as boundaries or sequence of polygons with minimum mappable areas • evaluate alternative data models (e.g. continuous) available with more recent developments in GIS, information capture, inference
Current and potential PEM goals/functions • Paradigm shift in forest resource management • need to provide more integrated ecosystem basis for resource inventory • Opportunity to extend beyond inventory to incorporate integrated modelling of critical environmental processes • forest ecosystem productivity - including timber production • biodiversity, carbon, nutrient cycling and export • water supply, sediment delivery • Develop integrated assessment and modeling of alternative forest resource/watershed management schemes
Issues to Consider for PEM/TEM Alternatives • Data Models: Continuous vs. discrete landscape paradigms • boolean or fuzzy logic/spatial representation • matching resolution to dramatically improved information base and storage/retrieval technology • Layer-based vs. entity (object) based • Top-down vs. bottom up approaches to ecosystem mapping, ecoregionalization, ecosystem modeling • Region splitting or region aggregation • Representation of internal (sub-entity) heterogeneity (in form and function)
II. Hierarchical integration of GIS/ecosystem models: top-down and bottom-up approaches • Landscape level: Forest ecosystem patterns conditioned by slope, aspect, elevation, substrate, hydrologic flowpaths effects on carbon processes, disturbance regime, regeneration - amenable to bottom-up (aggregation) approach as well as incorporation of system dynamics • Regional level: Synoptic climate and physiographic province level controls on large scale forest ecosystem patterns - amenable to top-down (disaggregation) approach
Example of a top down ecoregionalization: Satellite driven simulation of Provincial patterns of forest productivity (gm.C.m-2 .yr-1) - calibrated with landscape level estimates:• Use as ecosystem metric (along with drivers - climate, substrate, terrain) to regionalize ecosystem function • Regression tree model (RT) summarizes nested effects of climate, substrate, terrain drivers on productivity - RT nodes become ecosystem units with pop. statistics (e.g. means, variances, covariances of NPP, T, pcp, elev., slope, … known) • Pathfinder resolution (1-8km) adequate down to level of ecodistrict - inadequate below
• Satellite driven simulation of forest productivity at the provincial level guides recursive decomposition of the landscape (productivity field) into nested, functional ecoregions with minimum w/n unit variation in productivity, and productivity drivers (terrain, climate, …) • Each region has consistent documented relations between productivity and abiotic drivers • Aggregation/disaggregation methods fully documented and reproducible
Alternative or Complementary Bottom-Up Approach Regional HydroEcological Simulation System:Formal geomorphic hierarchy for landscape representation Surface attributes and processes bound at specific class levels in nested landscape model
Data model and data flow resembles PEM framework: GIS based hierarchical landscape ecosystem representation
Landscape partitioned successively into watersheds (basins) and hillslopes arranged and organized by drainage network. Hillslopes partitioned into functional patches (can be grid cells as special case) containing soil, vegetation attributes and processes Ability to associate dynamic (process) behaviour with specific class levels e.g. radiation, carbon, nutrient cycling, runoff, soil moisture, ...
Explicit and index distribution approaches for hillslope hydrology and ecosystem characteristics and processes Higher order units (subwatersheds, basins, landscapes aggregated from lower order units)
3-D Perspective of HJ Andrews Terrain 1. Extract/synthesize geomorphic hierarchy 2. Map/infer canopy, soils information
Hierarchical partitioning of Lookout Ck into geomorphic units - coarse stream network version
Simulate/map any model variable (input/output, storage) at aggregated time steps (days-decades), and scales (patches-landscape) Distribution of August ET over HJ Andrews landscape simulated and mapped at the Patch Level
Knowledge Documentation Soil-Landscape Model Building S <= f ( E ) Inference Engine 3. Knowledge based, continuous inference schemes • Soils typically unavailable at similar resolution to terrain, canopyand do not occur as “pure” entities • Soil Inference Model (SoLIM) developed for estimation of soil fields using GIS/soil-landscape model • Methods extensible to ecosystem classes as PEM framework Hardened polygon maps Similarity maps Soil attributes GIS/RS information
resembles resembles at Sijk resembles resembles at Sij2 at Sijn at Sij1 as expressed SoLIM inference of fuzzy membership in multiple soils at the same location: can handle soil/ecosystem mixtures Category 1, Category 2, …, Category k, …, Category n ... Soil at point (i,j) Similarity Vector (S) (Sij1, Sij2, …, Sijk, …, Sijn) (Zhu and Band, 1994, Can. J. Rem. Sensing)
Case-Based Reasoning Data Mining Local Experts’ Expertise Artificial Neural Network Spatial Distribution Perceived as Cl, Pm, Og, Tp Inference (under fuzzy logic) Similarity Maps G.I.S. SoLIM KB approaches need to be flexible to take advantage of differing data availability/land characteristics/ecosystem models and driving questions for different biomes Soil landscape model: currently uses info from GIS, RS, extend to include model predictions S <= f ( E ) (Zhu and Band, 1994, CJRS)
GIS/RS/Model Techniques Knowledge Acquisition Fuzzy Inference Engine Sij(Sij1, Sij2, …, Sijk, …, Sijn) Methods can relate both primary environmental data (slope, aspect, soil type) and model derived data (soil water stress indices) to infer soil/ecosystem classes or properties (Knowledgebase) (GIS Database) (Similarity Representation) (Zhu, 2000)
Catenary Sequence: Soil series or phases closely associated and intermixed as inclusions, complexes or intermediate forms (Zhu, 2000)
Grey scale mapping of membership functions indicates gradational variation of continuous fields and uncertainty of location and attribute Can use membership functions to estimate attribute values intermediate to soil central concepts (Zhu, 2000)
Inferred soil patterns with conventional boundaries Elevation Planform Curvature Geology Slope Gradient Field validation of inferred soil properties shows comparable to better results to those derived from standard soil maps in areas with moderate to high relief Up Stream Drainage Profile Curvature (Zhu, 2000)
Overview of the Analytical Framework and Research Components Input Methods Variables Analysis Results Evaluation Vegetation & Soil Parameters Resource & Temperature Gradients Predictive Accuracy Hydro-Ecological Modeling Climate Data Digital Terrain Data Predictive Vegetation Maps Statistical Modeling Residual Analyses Field Sampling Species Composition Species Response & Life-History Models Substrate Rockiness Geologic Structure Measurements Substrate & Geological Factors Ecophysiological Literature GIS Modeling & Map Digitization Lithologic Formations Satellite Imagery Meetenmeyer and Moody, 2001
Bonferroni Multiple Comparisons Days of Drought Stress (1987-90)
IV. Comments and Recommendations • British Columbia’s Biogeoclimatic Ecosystem Classification provides a state-of-the-art knowledge base for supporting TEM/PEM initiatives • Initial work in different regions is impressive and reflects driving questions and technology available - both of which change very rapidly • Forest management paradigm shift requires more integrated, flexible tools that can address ‘multiple use-multiple impact’ • Development of continuous classification systems and integrated landscape ecohydrological models provide opportunities for building onand extending PEM/TEM initiative
• Similar to PEM: accuracy and robustness of SoLIM-like approach highly dependent on knowledge base and implementation - • A limitation of relying on primary GIS variables (e.g. elevation, slope, aspect) is the production of multiple instances of the same entity (same soil series or forest ecosystem on south and north facing slope, different elevations) - concept of ecological equivalence• More direct variables (temperature, pcp, radiation load), or direct physiologic limitations on NPP, NEP could be derived from distributed hydroecological model
Need to develop menu of standardized techniques for knowledge capture, representation and inference methods to deal with range of ecosystems, available data, practitioners and driving questions • Choice of KB development dependent on availability of local data and expertise • Methods of assessing and representing data and inference method uncertainty • Software system needs to be extensible and built for interoperability to incorporate existing and developing models appropriate for range of ecosystems and issues
• Fuzzy inference methodology should be easily extensible to ecosystem entities:• Fuzzy PEM (or similar approach) would support representation of spatial and attribute uncertainty, take advantage of existing state-of-the-art forest ecosystems knowledge base to produce continuous classifications • Make use of derived direct biophysical (e.g. climate, soil water) and physiological fields (for reference canopy) to gain more insight into what are the direct controls on ecosystem form and function • Use enhanced attribute fields of forest ecosystem patterns to couple with dynamic models of critical environmental processes - extend ecosystem modelling to include greater treatment of ecosystem dynamics