Download
1 / 36
360 likes | 484 Views
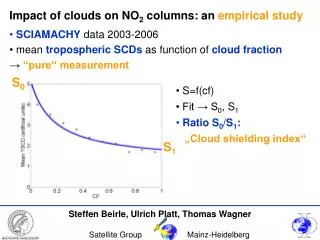
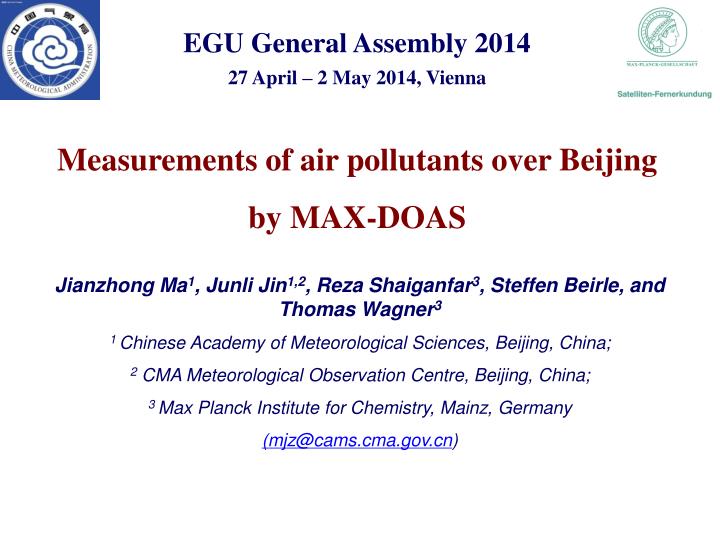
EGU General Assembly 2014 27 April – 2 May 2014, Vienna Measurements of air pollutants over Beijing by MAX-DOAS. Jianzhong Ma 1 , Junli Jin 1,2 , Reza Shaiganfar 3 , Steffen Beirle, and Thomas Wagner 3 1 Chinese Academy of Meteorological Sciences, Beijing, China;

E N D
EGU General Assembly 2014 27 April – 2 May 2014, Vienna Measurements of air pollutants over Beijing by MAX-DOAS Jianzhong Ma1, Junli Jin1,2, Reza Shaiganfar3, Steffen Beirle, and Thomas Wagner3 1 Chinese Academy of Meteorological Sciences, Beijing, China; 2 CMA Meteorological Observation Centre, Beijing, China; 3 Max Planck Institute for Chemistry, Mainz, Germany (mjz@cams.cma.gov.cn)
Measurements of air pollutants over Beijing by MAX-DOAS EGU General Assembly, 27 April - 2 May 2014, Vienna Outline 1. Motivation 2. MAX-DOAS observations in and around Beijing 3. Comparisons with satellite data 4. Summary and future work
Measurements of air pollutants over Beijing by MAX-DOAS EGU General Assembly, 27 April - 2 May 2014, Vienna Outline • 1. Motivation • 2. MAX-DOAS observations in and around Beijing • 3. Comparisons with satellite data • 4. Summary and future work
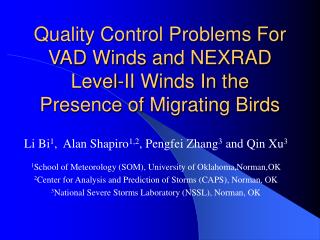
Can satellite see air pollution in China precisely? Pollution hot spots Central East China (North China or Huabei, 华北) Richter et al., Nature, 2005
GOME2: 59% GOME2: 59% OMI: 43% OMI: 40% OMI: 40% 2008 2005-2007 Satellite data should be validated quantitatively!
Measurements of air pollutants over Beijing using MAX-DOAS EGU General Assembly, 27 April - 2 May 2014, Vienna Outline • 1. Motivation • 2. MAX-DOAS observations in and around Beijing • 3. Comparisons with satellite data • 4. Summary and future work
CMA MAX-DOAS observation sites in and around Beijing Shangdianzi station (rural) Aug. 2008 – Mar. 2011 Beijing station (urban) Aug. 2008 - now Beijing (BJ), Tangshan (TS), Tianjin (TJ), and Shijiazhuang (DJZ) cities Gucheng station (rural) Sept. 2008 – Sept. 2010 Model result from Ma et al., ACP, 2012
12 Aug 2008, 12:32-12:35 MAX-DOAS in urban Beijing Geometry approximation Mini MAX-DOAS: 2048 pixels, 292-436 nm Ma et al., ACP, 2013
MAX-DOAS observation in urban Beijing 10th (90th) and 25th (75th) percentiles, minimum (maximum) values, and medians and mean values. Ma et al., ACP, 2013
MAX-DOAS observation in urban Beijing A more pronounced seasonal variation would be detected by satellite overpassing in the afternoon than in the morning. SCIA 10:45 OMI 13:30 Diurnal variations for different seasons from Aug. 2008 to Sept. 2011. Ma et al., ACP, 2013
MAX-DOAS observation in urban Beijing Reduction in 2008 relative to 2009 Post–Olympic effect more reduction in the in the late morning. Monthly mean diurnal variations in August of different years Ma et al., ACP, 2013
a good representativeness of the urban atmosphere over Beijing Hendrick et al., ACP, 2014
Measurements of air pollutants over Beijing using MAX-DOAS EGU General Assembly, 27 April - 2 May 2014, Vienna Outline • 1. Motivation • 2. MAX-DOAS observations in and around Beijing • 3. Comparisons with satellite data • 4. Summary and future work
Satellite validation: Tropospheric NO2 over Beijing SCIAMACHY DOMINO-v1.02 (2008-2010) (2008-2009) DOMINO-v2.0 DOMINO-v1.02 (2008-2009) (2008-2011) Satellite underestimates by 43% for SCIAMACHYand by 26-38% forOMI Ma et al., ACP, 2013
Satellite validation: Gird smoothing effect “true distribution” OMI 26×13 km2SCIA60×30 km2 Nighttime light 0.1×0.1 OMI winter OMI summer Smoothing factor = “true” /smoothed= 12 Ma et al., ACP, 2013
Satellite validation: Aerosol shielding effect aerosols 0-1 km NO2 0-200m Shielding factor = “true” /calculated = 23 Ma et al., ACP, 2013
Poster in Session AS3.12/GI2.10: EGU2014-4636 CMA MAX-DOAS observation around Beijing MAX-DOAS/OMI = 1.21.8 Beijing (BJ), Tangshan (TS), Tianjin (TJ), and Shijiazhuang (DJZ) cities Gucheng station (rural) Sept. 2008 – Sept. 2010 grid smoothing effect can be neglected at Gucheng. Jin et al., EGU General Assembly, Vienna, 2014
Measurements of air pollutants over Beijing using MAX-DOAS EGU General Assembly, 27 April - 2 May 2014, Vienna Outline • 1. Motivation • 2. MAX-DOAS observations in and around Beijing • 3. Comparisons with satellite data • 4. Summary and future work
Measurements of air pollutants over Beijing using MAX-DOAS EGU General Assembly, 27 April - 2 May 2014, Vienna Summary • We have retrieved the vertical column densities of tropospheric NO2over Beijing and its surrounding area from MAX-DOAS measurements; • The seasonal and diurnal variations of tropospheric NO2have been characterized, which provides valuable information for the assessment of satellite data; • Satellite observations underestimate tropospheric NO2in both urban and rural areas in and around Beijing compared to MAX-DOAS measurements.
Measurements of air pollutants over Beijing using MAX-DOAS EGU General Assembly, 27 April - 2 May 2014, Vienna Future work • To retrieve the vertical column densities of other gases, e.g., SO2 and HCHO, in the troposphere; • To do vertical distribution inversion of tropospheric aerosols and gases; • To continue satellite validation work.
3 parameters for vertical distribution: • VCD, AOD • Profile type: S • Layer height: L Aerosol and Trace gases VCD and vertical distribution retrieval based on radiative transfer simulations Wagner et al., AMT, 2011
Vertical Profiles for Gucheng: 2008.10.10 (clear day) S=1.5,linear-increase S=1.5, elevated-layer S=1.2,linear-increase S=1.2, elevated layer
S=1.0,box S=0.8 All free S=0.5
Comparison with sunphotometer AODat Gucheng for clear days In DOY 332 and 333, inversion result of S=1.5 are always the closest to sunphotometer result. But the sub-shape parameter (elevated layer or linear-increase) are mixed. 2008-11-27 2008-11-27 2008-11-29
Aircraft field campaign during 17 Sept. – 13 Oct. 2008 CMA MAX-DOAS observation around Beijing Beijing (BJ), Tangshan (TS), Tianjin (TJ), and Shijiazhuang (DJZ) cities Gucheng station (rural) Sept. 2008 – Sept. 2010
SO2 NOx 0.46- 30 m 5.6-560 nm
谢谢!Thank you for your attention!
卫星资料 Ozone Monitoring Instrument(OMI) DOMINO v1.02 DOMINO v2.0 SCanning Imaging Absorption spectroMeter for Atmospheric CHartographY (SCIAMACHY) ESA satellite ENVISAT, March 2002. 8 channels, 240–2380 nm with a spectral resolution of 0.22–1.48 nm. Tropospheric NO2 columns: 430–450 nm (channel 3). A local equator crossing time of about 10:00 a.m. Global cover of nadir measurements is achieved after 6 days. The footprint 30×60 km2. NASA’s EOS Aura satellite, July 2004 3 channels, 270 nm to 500 nm with a spectral resolution of about 0.5 nm. Tropospheric NO2 are columns: 405–465 nm spectral window A local equator crossing time between 13:40 and 13:50 local time. Achieve complete global coverage in one day. Its spatial resolution is 24×13 km2in nadir, 68×14 km2 at the swath edges.
Longterm observations in Shangdianzi Wind Rose Precipatation Meteorological parameters……
Longterm observations in Gucheng: • Gaseous pollutant:O3, SO2, NOx, CO • Aerosol particles: • balck carbon,PM10/PM2.5/PM1.0, AOD • Meteorological parameters:Wind, T, P, RH, UV,……
气溶胶吸收系数(黑碳)(1min) Aethalometer(AE31,Magee Sci.) 散射系数 (1min) Nephelometer (M9003,Ecotech)