Download
1 / 52
530 likes | 696 Views
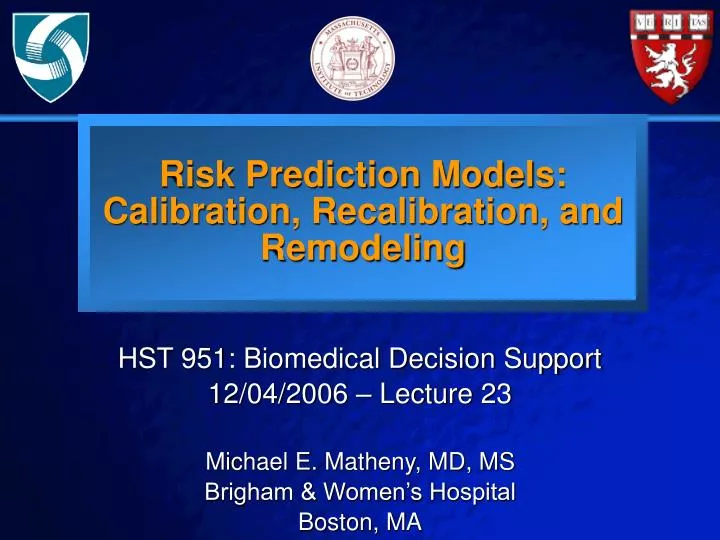
Risk Prediction Models: Calibration, Recalibration, and Remodeling. HST 951: Biomedical Decision Support 12/04/2006 – Lecture 23 Michael E. Matheny, MD, MS Brigham & Women’s Hospital Boston, MA. Lecture Outline. Review Risk Model Performance Measurements

E N D
Risk Prediction Models: Calibration, Recalibration, and Remodeling HST 951: Biomedical Decision Support 12/04/2006 – Lecture 23 Michael E. Matheny, MD, MS Brigham & Women’s Hospital Boston, MA
Lecture Outline • Review Risk Model Performance Measurements • Individual Risk Prediction for Binary Outcomes • Inadequate Calibration is “the rule not the exception” • Addressing the problem with Recalibration and Remodeling
Model Performance Measures • Discrimination • Ability to distinguish well between patients who will and will not experience an outcome • Calibration • Ability of a model to match expected and observed outcome rates across all of the data
DiscriminationArea Under the Receiver Operating Characteristic Curve
Standardized Outcomes Ratio • Most Aggregated (Crude) comparison of expected and observed values • 1 Value for Entire Sample • Risk-Adjusted by using a risk prediction model to generate expected outcomes
Standardized Mortality Ratios(SMR) CANCER MORTALITY ANALYSIS ALL MALES, SCRANTON CITY, 1975-1985
Outcome Ratios • Strengths • Simple • Frequently used in medical literature • Easily understood by clinical audiences • Weaknesses • Not a quantitative test of model calibration • Unable to show variations in calibration in different risk strata • Likely to underestimate the lack of fit
Global Performance Measurementswith Calibration Components • Methods that calculate a value for each data point (most granular) • Pearson Test • Residual Deviance • Brier Score
Brier Score Calculation • To assess the accuracy of the set of predictions, Spiegelhalter’s method is used • Expected Brier (EBrier) = 0.18775 • Variance of Brier (VBrier) = 0.003292
Brier Score • Strengths • Quantitative evaluation • Weaknesses • Sensitive to sample size (↑sample size more likely to fail test) • Sensitive to outliers (large differences between expected and observed) • Difficult to determine relative performance in risk subpopulations
Hosmer-LemeshowGoodness of Fit • Divide the data into subgroups and compare observed to expected outcomes by subgroup • C Test • Divides the sample into 10 equal groups (by number of samples) • H Test • Divides the sample into 10 groups (by deciles of risk)
Hosmer-LemeshowGoodness of Fit • Strengths • Quantitative evaluation • Assesses calibration in risk subgroups • Weaknesses • Disagreement with how to generate subgroups (C versus H) • Even among the same method (C or H), different statistical packages generate different results due to rounding rule differences • Sensitive to sample size (↑sample size more likely to fail test) • Sensitive to outliers (but to a lesser degree than Brier Score)
Risk Prediction Modelsfor Binary Outcomes Case Data (Variables X1..Xi) -> Predictive Model for Outcome Y (Yes/No) -> Case Outcome Prediction (0 – 1) • Logistic Regression • Bayesian Networks • Artificial Neural Networks • Support Vector Machine Regression
Risk Prediction ModelsClinical Utility • Risk Stratification for Research and Clinical Practice • Risk-Adjusted Assessment of Providers and Institutions • Individual risk prediction
Individual Risk Prediction • Good discrimination is necessary but not sufficient for individual risk prediction • Calibration is the key index for individual risk prediction
Inadequate CalibrationWhy? • Models require external validation to be generally accepted, and in those studies the general trend is: • Discrimination retained • Calibration fails • Factors that contribute to inadequate model calibration in clinical practice • Regional Variation • Different Clinical Practice Standards • Different Patient Case Mixes • Temporal Variation • Changes in Clinical Practice • New diagnostic tools available • Changes in Disease Incidence and Prevalence
Individual Risk PredictionClinical Examples • 10 year “Hard” Coronary heart disease risk estimation • Logistic Regression • Framingham Heart Study • Calibration Problems • Low SES • Young age • Female • Non-US populations Kannel et al. Am J Cardiol, 1976
Individual Risk PredictionClinical Examples • Lifetime Invasive Breast Cancer Risk Estimation • Logistic Regression • Gail Model • Calibration Problems • Age <35 • Prior Hx Breast CA • Strong Family Hx • Lack of regular mammograms Gail et al. JNCI, 1989
Individual Risk PredictionClinical Examples • Intensive Care Unit Mortality Prediction • APACHE-II • APACHE-III • MPM0 • MPM0-II • SAPS • SAPS-II
Individual Risk PredictionClinical Examples Ohno-Machado, et al. Annu Rev Biomed Eng. 2006;8:567-99
Individual Risk PredictionClinical Examples Ohno-Machado, et al. Annu Rev Biomed Eng. 2006;8:567-99
Individual Risk Prediction Clinical Examples • Interventional Cardiology Mortality Prediction Matheny, et al. J Biomed Inform. 2005 Oct;38(5):367-75
Individual Risk Prediction Clinical Examples Observed Deaths = 71 Matheny, et al. J Biomed Inform. 2005 Oct;38(5):367-75
Inadequate CalibrationWhat to do? • In most cases, risk prediction models are developed on much larger data sets than are available for local model generation. • Decreased variance and increased stability of model covariate values • Large, external models (especially those that have been externally validated) are generally accepted by domain experts • Goal is to ‘throw out’ as little prior model information as possible while improving performance
Recalibration and RemodelingGeneral Evaluation Rules • Model recalibration or remodeling follows the same rules of evaluation as model building in general • Separate training and test data, or • Cross-Validation, etc • If temporal issues are central to that domain’s calibration problems, training data should be both before (in time) and separate from testing data
Logistic RegressionGeneral Equation • B0 is the intercept of the equation, which represents the outcome probability in the absence of all other risk factors (baseline risk) • The model assumes each covariate is independent of each other, and Bx is the natural log of the odds ratio of the risk attributable to that risk factor
Logistic Regression”Original” Model and Cases • Minimum predicted risk for each case is intercept only • Adjusting intercept scales all results * Case 4 is Outcome = 1, Case 1 -3 are Outcome = 0
LR Intercept Recalibration • The proportion of risk contributed by the intercept (baseline) can be calculated for a data set by:
LR Intercept Recalibration • The intercept contribution to risk (RiskInt(%)) is multiplied by the observed event rate, and converted back to a Beta Coefficient from a probability: • A relative weakness of the method is that values can exceed 1, and must be truncated
LR Intercept RecalibrationExample Model and Cases • Original Expected = 0.51 • Intercept Recalibration Expected = 0.90
LR Slope Recalibration • In this method, the output probability of the original LR equation is used to model a new LR equation with that output as the only covariate:
LR Slope RecalibrationExample Model and Cases • Original Expected = 0.51 • Slope Recalibration Expected = 0.88
LR Covariate Recalibration • Original Expected = 0.51 • Covariate Recalibration Expected = 0.97
Clinical ApplicationsCALICO • California Intensive Care Outcomes (CALICO) Project • 23 Volunteer Hospitals beginning in 2002 • Compare hospital outcomes for selected conditions, procedures, and intensive care unit types • Identified popular, well-validated models • MPMo-II, SAPS-II, APACHE-II, APACHE-III • Evaluated the models on CALICO data, after determining they were inadequately calibrated, conducted recalibration of each of the models using the LR Covariate Recalibration method