Download
1 / 4
60 likes | 361 Views
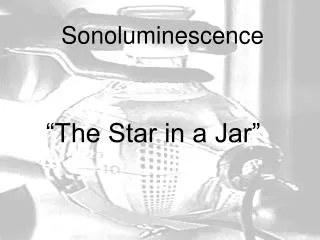
An example problem in sonochemistry and sonoluminescence.

E N D
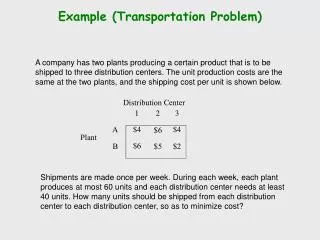
An example problem in sonochemistry and sonoluminescence Ultrasound in liquid can generate and then collapse gas bubbles. The compressed gas inside the collapsing bubbles becomes hot, in much the same way as the gas within a bicycle pump gets hot way new pump up the bicycle tyre. In fact, it can reach temperatures similar to those found on the surface of the sun (6000K). This can cause chemical reactions to take place within the gas and the liquid, one result of which is the emission of light, called sonoluminescence. The ability of ultrasound to cause chemical reactions in this way is called sonochemistry. In this presentation we are going to illustrate these effects by looking at one example problem in the field. Chemists often examine the efficiency of ultrasound to produce chemical reactions, by comparing the sono chemical yield as the frequency of the sound field changes. In this way they hope to find the optimal frequency to use. We will here show that the usual approach, of looking at a number of discrete frequencies (say, 100 kHz, 250 kHz, 500 kHz, 1000 kHz)is misleading, because the effectiveness of the ultrasound field in a typical vessel can vary hugely over changes are frequency of as little as 1 kHz. This is demonstrated by monitoring the sonoluminescence given out by the bubbles.
5 cm For the typical frequency is used rise on a chemist and the typical size of beaker employed, the sound field is not uniform throughout this vessel, but rather displays modes. Within a cylindrical vessel like this, the modes are typified by rings of high intensity sound when viewed from above, and bands when viewed from the side. The sort of vessel that is typically used might resemble a beaker of circular cross-section, against the bottom of which is placed the transducer which generate the ultrasound (see below). These are readily imaged by photographing the sonoluminescence, which is brightest from the regions where the sound field has highest amplitude. The camera of view from above is shown below, and next to it we see the camera view from the side. ‘Top’ view camera position ‘Side-on’ camera position Liquid Ultrasonic transducer O ring seal
Now look at the view from above when the sound frequency is increased in 1 kHz increments. 58mm Between 116-118 kHz you might think that the sonoluminescence increases with frequency. But if you were only to look between 126-128 kHz, you might think that the luminescence decreases with frequency. If you look through the whole range of 116-130 kHz, you see that a 1 kHz change can make difference, either increasing or decreasing luminescence: Look at the effect of going from 121-123 kHz ! So the usual method of making jumps of 100 kHz or more clearly misses the detail of what is going on, and conclusions about the ‘optimal’ frequency for sonochemistry can be misleading. 116 kHz 117 kHz 118 kHz 119 kHz 120 kHz ______________________________________ | | | | | | | | |_____________________________________| 125 kHz 121 kHz 124 kHz 123 kHz 122 kHz 126 kHz 127 kHz 129 kHz 130 kHz 128 kHz
Indeed, this also has implications for calorimetry, what is considered by some sonochemists to be the standard way of measuring the ultrasonic power. You estimate the ultrasonic power from the temperature rise the ultrasound produces in the liquid. But if the temperature rises, the sound speed rises, and the frequency at which a specific mode occurs changes., Hence the act of making a calorimetric measurement can completely change the sonochemical efficiency of the system. For example, for every 1°C rise in water temperature, the percentage change in the frequency at which a given mode occurs is f/f= 0.3 % Typically during calorimetry the liquid temperature rises by ~3°C (i.e.f/f~1%) The video opposite shows what happens when one changes the driving frequency by only 0.5%: one moves into and out of a mode, and the luminescence changes dramatically. Principal Investigator: TG Leighton (ISVR, University of Southampton) Co-investigators: PR Birkin (Department of Chemistry) Student: JF Power Sponsor: EPSRC Grant: “Characterisation of acoustic and luminescent techniques” (GR/M24615/01)