Download
1 / 24
240 likes | 316 Views
IDEA: Unlocking the Results. Faculty Workshop Stephanie Juillerat, Ph.D. Associate Dean, BAS. Remember the IDEA?. 6 sections (long form) 1) 20 teaching items based on 5 dimensions of instruction Linked reliably to student progress on course objectives

E N D
IDEA: Unlocking the Results Faculty Workshop Stephanie Juillerat, Ph.D. Associate Dean, BAS
Remember the IDEA? • 6 sections (long form) 1) 20 teaching items based on 5 dimensions of instruction • Linked reliably to student progress on course objectives • Students rate how frequently you engage in them 2) 12 course objectives (instructor rates in advance the importance of each) 3) 3 items comparing your course to others taken 4) 7 items re: self-rating of student attitudes & ratings of overall excellence of your teaching & the course 5) 5 experimental questions • 20 instructor-designed questions (insert 3 faith integration questions here) • Short form has sections 2, 4, & 6 (10 items)
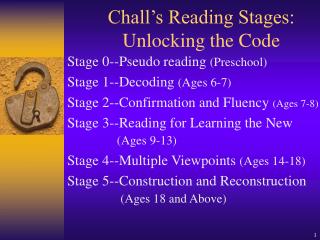
Where do report scores come from? • Students report progress they made on each of the 12 educational objectives on IDEA 1 = no apparent progress 2 = slight progress (small gains) 3 = moderate progress (some gains) 4 = substantial progress (large gains) 5 = exceptional progress (outstanding gains) • Progress scores are used only for objectives you selected as important (single weight) or essential (double weight) • Adjustments are made to scores based on factors beyond your control (student motivation, work habits, class size, course difficulty, student effort)
Page 1 of report (long or short form) • Reliability information & brief explanation of adjusted scores (standard language) • Scores presented in two formats • Using the 1-5 rating scale (on left side) • Using converted scores CFEP requires the reporting of adjusted t-scores for Box A and Box B • Comparisons are made to IDEA database, Discipline & Institution
The boxes • Box A – Progress on Relevant Objectives • Average of student responses on important and essential objectives (essential gets double counted) • Box B – Excellent Teacher • Average student response to single item • Box C – Excellent Course • Average student response to single item • Box D – Summary Score Averaging B and C • Box E – Summary Score Averaging A and D
Why we use converted scores • Scores on 1-5 scale do not take into account that some objectives are more difficult than others • Average score for factual knowledge objective is 4.0 but for objective on cultural appreciation is 3.69 • Faculty choosing more challenging educational outcomes and scoring at average are penalized • Converted scores provide accurate comparative data • Average score becomes 50 for every objective • Converted scores also allow for normative comparisons
Why we use adjusted converted score instead of raw converted score • Using converted scores is not enough • Some factors that are beyond faculty control can influence student ratings • Student motivation, student work habits, class size, perceived difficulty of course, student effort • The converted score can be statistically adjusted for those factors to produce a fair comparison • Adjustment can be made upward or downward to level the playing field
Page 2 of report (long or short form) • Breakdown of each learning objective you selected as important or essential and how the students responded • Again, uses the 5-point scale and the converted score • Tells you what percentage of students reported low progress (1 or 2) and high progress (4 or 5) on the objectives • Bi-modal distribution suggests different learners
Page 3 of report (long form only)Suggestions for Improved Teaching • Takes student responses to 20 teaching behaviors and indicates, based on the objectives you selected, which ones to • Possibly increase use (retain current use or consider increasing) • Definitely increase use (consider increasing use)**** • Maintain use but don’t increase (strengths to retain) • Because these behaviors are linked to student ratings of progress, changing your behavior should result in different scores next time
Page 4 of report(long and short form) • Lots of statistical detail • Student responses to every item on IDEA • Most useful to look at 12 educational objectives to see if students’ perceptions match yours • Sometimes students rate progress on an objective that surprises you • Additional questions listed at bottom of page • This is where faith integration data will be
IDEA and CFEP • IDEA scores are recorded as one of the components in Educator-Mentor • Record Adjusted Score in Box A and Box B • Adjusted t-score of 50 = 3.0 in CFEP • 3 faith integration items count as well • 3.8 on 5-point scale converts to a 3.0 in CFEP • If students don’t complete faith integration items, your score will take a nose dive!
Improving your IDEA scores • If Box A results seem low, look at 2 things: • Suggestions provided on page 3 of long form • Most important teaching component for all objectives is “stimulating student interest” • Re-evaluate the objectives you selected • Make sure your course and its activities are addressing the objectives you select • Choose the appropriate number of objectives
Selecting Objectives • Inverse relationships between # of objectives and Box A scores • Choose no more than 3-5 or you may spread yourself too thin • 3 questions for determining if an objective should be selected as essential or important • Is this objective a significant part of the course? • Do I do something specific to help students accomplish this objective? • Does the student’s progress on this objective affect his or her grade?
Explain objectives to students • Many faculty think it’s cheating to explain what objectives were chosen and why • This gives students valuable information to make informed ratings of progress • Clearly identify how each objective was addressed and assessed in class (include in syllabus) • Explain faith integration questions as well!
Other Ways to Improve Scores • If Box B (teacher excellence) score is low, look at feedback given in comment section • Teacher excellence is often a matter of good organization and rapport with students • 3 teaching components are equally important for high scores on Box B • Structuring the Classroom Experience • Establishing Rapport • Stimulating Student Interest
Help Students Take the ProcessSeriously • Set the expectation that students should take this process seriously by taking it seriously yourself • Come prepared with the FIF form completed • Post faith integration questions before leaving • Explain to students how IDEA works • Share the importance of the data they provide to your own advancement/re-hiring/improvement • Let students know their comments will be read • Don’t give IDEA on a day with a major assessment
Ask for Help • My job is to provide assistance so that you can succeed • Many helpful reports on www.idea.ksu.edu • Directors of Faculty Development or Faculty Evaluation, other faculty who teach courses similar to yours, department chairs
Other Questions? • Contact the Office of Faculty Evaluation for any logistical questions • Contact Stephanie Juillerat for any philosophical questions (5927)