Download
1 / 23
240 likes | 344 Views
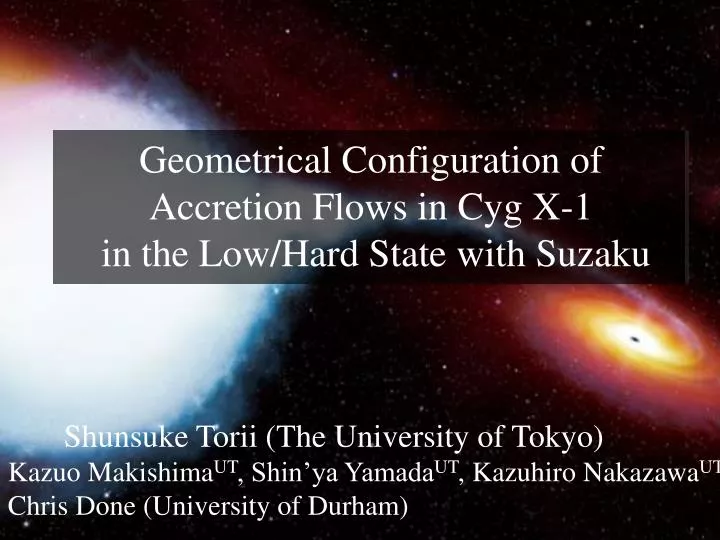
Geometrical Configuration of Accretion Flows in Cyg X-1 in the Low/Hard State with Suzaku. Shunsuke Torii (The University of Tokyo) Kazuo Makishima UT , Shin’ya Yamada UT , Kazuhiro Nakazawa UT , Chris Done (University of Durham). 1. Low/Hard State Pictures. Zdziarski+ 2004.

E N D
Geometrical Configuration of Accretion Flows in Cyg X-1 in the Low/Hard State with Suzaku Shunsuke Torii (The University of Tokyo) Kazuo MakishimaUT, Shin’ya YamadaUT, Kazuhiro NakazawaUT, Chris Done (University of Durham) High Energy View of Accreting Objects: AGN and X-ray Binaries
1. Low/Hard State Pictures Zdziarski+ 2004 • Emission mechanism: Thermal Comptonization • Geometry: A cool disk and a hot corona Suzaku Still unknown are • What supplies seed photons to the Comptonizing corona? • What is the geometry of the disk and the corona like? • What is the origin of fast time variability? High Energy View of Accreting Objects: AGN and X-ray Binaries
2-1. Suzaku Results on Cyg X-1: Time Averaged Spectra (Makishima+ 2008) • Suzaku observation in the Low/Hard State, total exposure of 17 ks νFν spectrum of Cygnus X-1 • Hot corona(xspec compPS) • Hard optical depth ~ 1.5 • Soft opt. dep. ~ 0.4 • Te ~ 100 keV, Rseed ~ 210 km • Directly visible cool disk • Tin ~ 0.2 keV, Rin ~ 250 km • Weakly broadened Iron line • EC 6.3 keV, EW 290 eV • Sigma ~ 1 keV (consistent with 15 Rg) • Reflection from the disk • Omega / 2π ~ 0.4 • The disk is truncated • at √Rseed2+ Rin2 ~ 15 Rg χ2=1.13(349) Energy (keV) χ2 = 1.13 (349) High Energy View of Accreting Objects: AGN and X-ray Binaries
2-2: Intensity Sorted Spectra Ave. Sort events by XIS count rates into high or low on a time scale of 1 s 1 s bin High Energy View of Accreting Objects: AGN and X-ray Binaries
2-2: Intensity Sorted Spectra High events Low events From low to high • The corona • Seed photons • y-parameter • The disk • Tin • Rin • Fe-K line • EW • Reflection solid angle • Ω/2π Disk unchanged! High Energy View of Accreting Objects: AGN and X-ray Binaries
2-3: Interpretation from a Single Suzaku Observation • A cool disk and a hot corona of two optical depth • Inner disk radius is ~15 Rg(consistent with Fe-K line width) • The disk penetrates halfway into the corona (moderate reflection) • When the source flares up, the disk remains constant while seed photon increases and y-parameter decreases When XIS count rate is low Corona has many holes Compton raw disc reflection cool disk BH inhomogeneous corona High Energy View of Accreting Objects: AGN and X-ray Binaries
2-3: Interpretation from a Single Suzaku Observation • A cool disk and a hot corona of two optical depth • Inner disk radius is ~15 Rg(consistent with Fe-K line width) • The disk penetrates halfway into the corona (moderate reflection) • When the source flares up, the disk remains constant while seed photon increases and y-parameter decreases When XIS count rate is high Compton Disk coverage may increase? raw disc reflection cool disk BH inhomogeneous corona High Energy View of Accreting Objects: AGN and X-ray Binaries
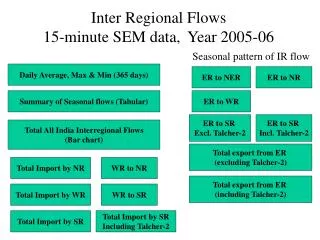
3-1:Further 24 Observations of Cyg X-1 with Suzaku • 25 observations • Low/Hard State • With various intensity • Use RXTE ASM count (CASM) as a soft X-ray flux indicator ● Suzaku Observation Hardness (5-12 keV/1.5-3 keV) 2 0 60 0 RXTE ASM (1.5-12 keV) count rate (s-1) High Energy View of Accreting Objects: AGN and X-ray Binaries
3-2: Three Representative Spectra: (1) XIS + HXD • Cutoff energy appears to be decreasing • Hard X-ray slope (high-τ Compton) softens • Contribution from a cool disk appears to be increasing • Low-τ Compton component increases → Concentrating on hard X-rays High Energy View of Accreting Objects: AGN and X-ray Binaries
3-3: Three Representative Spectra: (2) compPS Fit CASM=45.0 cts/s CASM=23.3 cts/s CASM=14.9 cts/s • The three spectra were reproduced with a single Compton component • The fit quantifies the inferences of the previous slide PIN GSO photon index cutoff energy ? reflection soft X-ray flux y= 1.39 Te= 76 keVΩ/2π= 0.25 y= 1.26 Te= 85 keVΩ/2π= 0.33 y= 1.00 Te= 78 keVΩ/2π= 0.39 χ2/dof=146/134 153/135 140/135 The fit was successful on the remaining data sets High Energy View of Accreting Objects: AGN and X-ray Binaries
3-4: Compton y-parameter vs. ASM count Te y ∝ Te×τ • y-parameter decreases from 1.4 to 1.0 when ASM countincreases by a factor of 3 • Cannot distinguish whether Te or τ decreases τ High Energy View of Accreting Objects: AGN and X-ray Binaries
3-5: Reflection vs. ASM count Ω/2π • Reflection solid angle increases by ~30% when CASM triples • Gilfanov+ (1999), Zdziarski+ (2000), Ibragimov+ (2005) High Energy View of Accreting Objects: AGN and X-ray Binaries
4-1: Power Spectral Density vs. ASM count Break frequency (νb) When CASM increases by a factor of 3, • time scale of variability ∝ νb-1 • low frequency power decreases by an order of magnitude PINdata (10-60 keV) 50 ms bin 409.6 s/interval Low frequency power (from 0 to 0.01 Hz) High Energy View of Accreting Objects: AGN and X-ray Binaries
4-1: Power Spectral Density vs. ASM count νPν Break frequency (νb) When CASM increases by a factor of 3, • time scale of variability ∝ νb-1 • low frequency power decreases by an order of magnitude PINdata (10-60 keV) 50 ms bin 409.6 s/interval Low frequency power (from 0 to 0.01 Hz) High Energy View of Accreting Objects: AGN and X-ray Binaries
4-2: Energy Dependence of Time Variability Cross correlation with 10-20 keV Auto correlation of 4 bands • Higher energy bands show narrower peaks (faster variability) • Correlations are all peaked at 0.0 +/− 0.1 s • Higher energy bands show more asymmetric form, with harder photons lagging to softer ones (see especially 100-200 keV one) 0.1 s bin 409.6 s/interval High Energy View of Accreting Objects: AGN and X-ray Binaries
5-1: Discussion on Mass Accretion Fluctuation Corona BH When mass accretion rate(∝CASM) increases • Variation time scale shortens, low frequency power decreases Outer radius of the corona decreases • Reflection solid angle increases The disk intrudes into the corona more deeply • y decreases Increased seed photons degrade Comptonization efficiency Disk High Energy View of Accreting Objects: AGN and X-ray Binaries
5-2:Discussion on Energy Dependence of Time Variability As energy gets higher • Variation time scale becomes shorter In higher energies, photons are emitted closer to BH • The hard lag becomes clearer Accreting matter falling in a viscous time scale of ~ 1 sec. hotter region High Energy View of Accreting Objects: AGN and X-ray Binaries
5-2:Discussion on Energy Dependence of Time Variability As energy gets higher • Variation time scale becomes shorter In higher energies, photons are emitted closer to BH • The hard lag becomes clearer Accreting matter falling in a viscous time scale of ~ 1 sec. hotter region Accreting blob High Energy View of Accreting Objects: AGN and X-ray Binaries
5-2:Discussion on Energy Dependence of Time Variability As energy gets higher • Variation time scale becomes shorter In higher energies, photons are emitted closer to BH • The hard lag becomes clearer Accreting matter falling in a viscous time scale of ~ 1 sec. hotter region Accreting blob High Energy View of Accreting Objects: AGN and X-ray Binaries
6: Summary • We analyzed 25 Suzaku observations of Cyg X-1. • As mass accretion rate increases, reflection solid angle increases and y, break frequency and low frequency powerdecrease. • Above can be explained by decreasing outer radius of the corona and deeper penetration of the accretion disk into the corona. • Higher energy photons vary more rapidly and have delayed components, compared to softer ones. • Energy dependence of time variability can be explained by taking into account falling time of accreting matter. High Energy View of Accreting Objects: AGN and X-ray Binaries
Appendix Deeper Analysis of Asymmetry in CCF • Parameterize hard lags by taking area ratios (B/A > 1) • Hard lags become more significant in softer observations? B A t = 0 B/A - 1 - 1 Lag in higher energy (s) High Energy View of Accreting Objects: AGN and X-ray Binaries
Chris and UT Model for a Hard Lag Behavior Geometry Energy spectra Corona BH • Extent of a hard lag depends on low-τ component • New insight for approaching a corona-disk geometry? HXD Harder obs Disk High-τ In the HXD region Low-τ High-τ dominant. Less asymmetric Softer obs Low-τinvades. More asymmetric High Energy View of Accreting Objects: AGN and X-ray Binaries
Supplement : PSD and ACF • Power spectral density (PSD) and auto correlation function (ACF) are Fourier conjugate, i.e. equivalent to each other • PSD has frequency domain while ACF has time domain • Time scale of variability in BHB appeared as a break in PSD while it appears as decay time of correlation in ACF • Faster variability, narrower peak in ACF PSD ACF Correlation Power density Frequency Time lag High Energy View of Accreting Objects: AGN and X-ray Binaries