Download
1 / 26
260 likes | 344 Views
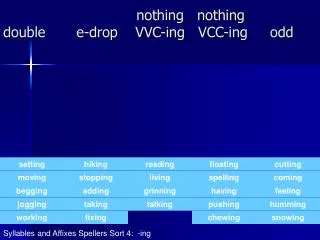
Comparative genomics and the new perspective on genome evolution. Nothing in ( computational ) biology makes sense except in the light of evolution. after Theodosius Dobzhansky (1970). 1. 101. 201. 301. 401. 1. 101. 201. 301. 401. 501. 601.

E N D
Comparative genomics and the new perspective on genome evolution Nothing in (computational) biology makes sense except in the light of evolution after Theodosius Dobzhansky (1970)
1 101 201 301 401 1 101 201 301 401 501 601 Conservation of gene order in bacterial species of the same genus M. genitalium vs M. pneumoniae
1 101 201 301 401 501 601 701 801 1 101 201 301 401 501 601 701 801 901 1001 Conservation of gene order in closely related bacterial genera C. trachomatis vs C. pneumoniae
Lack of gene order conservation - even in “closely related” bacteria of the same Proteobacterial subdivision P. aeruginosa vs E. coli
Genome Alignments - Method Protein sets from completely genomes BLAST cross-comparison Table of Hits Pairwise Genome Alignment Local alignment algorithm Lamarck (gap opening penalty, gap extension penalty); statistics with Monte Carlo simulations Template-Anchored Genome Alignment
0.5 cpneu-ctra mjan-mthe 0.4 bsub-ecoli drad-aero 0.3 0.2 0.1 0.0 2 3 4 5 6 7 8 9 10 11 12 13 14 15 16 17 18 19 20 >20 Genome Alignments - Statistics Distribution of conserved gene string lengths
Genome Alignments - Statistics Pairwise No. No. % in % in alignments: strings genes Gen1 Gen2 all homologs ecoli-hinf138 566 13% 33% ecoli-bsub 89 322 8% 8% ecoli-mjan 10 30 1% 2% probable orthologs ecoli-hinf105 482 11% 28% ecoli-bsub 34 168 4% 4% ecoli-mjan 12 33 1% 2%
5000 4500 4000 3500 3000 2500 2000 1500 1000 500 0 cjej aful cac hinf tpal ctra hpyl pyro rpxx aero bbur drad uure tmar ecoli bsub mjan mthe mtub mgen nmen aquae cpneu mpneu synecho Not in gene strings In non-conserved gene strings (directons) In conserved gene strings Genome Alignments - Statistics Breakdown of genes in the genome
Genome Alignments - Statistics Fraction of the genome in conserved gene strings - from template-anchored alignments MinimumSynechocystis sp. 5% Aquifex aeolicus10% Archaeoglobus fulgidus13% Escherichia coli14% Treponema pallidum17% MaximumThermotoga maritima 23% Mycoplasma genitalium 24%
The three domains of life: the Tree -proteobacteria -proteobacteria -proteobacteria spirochetes chlamydias Bacteria Bacillus/Clostridium group mycoplasmas actinobacteria Dra cyanobacteria Aae Tma Mth Mja Pxx Archaea Txx Afu crenarchaea Hbs eukaryota
The three domains of life: relationships within clusters of orthologs (COGs) Eukaryotes A 245 496 Bacteria A+B 1882 729 A+B+E 111 1087 A+E Archaea 315 Pan-archaeal COGs All COGs
Protein functions in the archaeo-eukaryotic and archaeo-bacterial subsets of the conserved archaeal core (310 COGs total)
Tpa W Ctr W Bbu W Aae W Afu W Mth W Mja W Eco W Hin W Mtu W Pho W Bsu W Hpy W Sce W cyt Ssp W Hsa W cyt Mpn W Cel W mit Mge W Sce W mit Sce E cyt Ath E cyt Hpy E /2/ Eco Q Hin Q Hpy E /1/ Hsa Q Bsu E Aae E Mge E Mpn E Sce Q Ssp E Afu E Mtu E Pho E Hin E Ctr E Eco E Mth E Sce E mit Sso E Tpa E Mja E Bbu E Cel E mit Phylogenetic trees of aminoacyl-tRNA synthetases: HGT comes out loud and clear
Eukaryotic programmed cell death - the bacterial contribution PC_Hsa Csp1_Hsa Mlr1804_Mlo CED3_Cel PC_Cel Csp2_Hsa Mll5190_Mlo Mlr3463_Mlo Csp10_Hsa Mll2372_Mlo Mlr2366_Mlo Csp3_Hsa Mlr3303_Mlo Csp9_Hsa CASP-like_Deha PC_Ddis Gingipain R_Pgin ActD_Mxan XF2779_Xfa Mlr3300_Mlo Gingipain K_Pgin YOR197w_Sce MC1_At PK3_Scoe MC_Spo MC3_At MC5_At MC_Geos MC_Rsph MC_Hbr MC4_At MC2_At Phylogenetic tree of the caspase-like protease superfamily
Inconsistency Quotient IQ = minimal number of events (Loss, Emergence, or HGT) required to reconcile a COG’s phyletic pattern with the topology of the species tree A B C D A B C D A B C D A B C D A B C D IQ=1 IQ=1 IQ=2 IQ=2 2 parsimonious scenarios Loss HGT
Number of gene loss and HGT events in most parsimonious evolutionary scenarios for COGs (I values).
Conclusion Comparative genomics shows that genome evolution is a highly dynamic process dominated by gene shuffling, lineage-specific gene loss and horizontal gene transfer