Download

1 / 23
230 likes | 388 Views
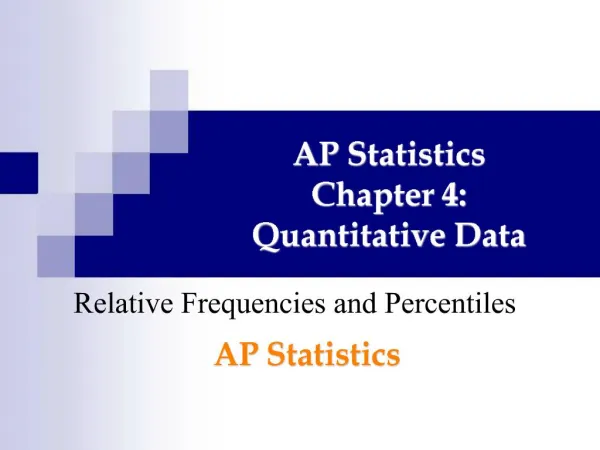
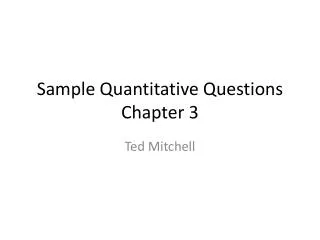
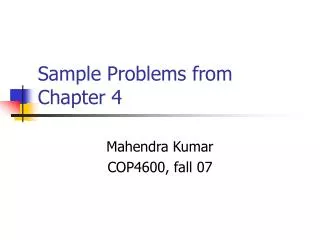
Sample Quantitative Questions Chapter 4. Ted Mitchell. A Marketing Machine Producing Revenues From the 4P’s. Inputs to The Marketing Machine . Place. Promotion. Price Tags. Product Quality. The Marketing Machine. Revenue. Revenues. Revenue. Revenue.

E N D
Sample Quantitative QuestionsChapter 4 Ted Mitchell
A Marketing Machine Producing Revenues From the 4P’s Inputs to The Marketing Machine Place Promotion Price Tags Product Quality The Marketing Machine Revenue Revenues Revenue Revenue Revenue Output from The Marketing Machine
1) Analysis of a Revenue Machine from Total Expenditure on Servers • You own two coffee shops. You are trying to understand the role that servers play in the creation of revenues • The shops sell 3 different size coffees and pastries and you have aggregated information on the weekly revenues and the total amount spent on servers each week. • Coffee shop #1 spends $1,333 on server wages and generates $10,000 in revenues • Coffee shop #2 spends $2,000 on server wages and generates $14,000 in revenues • What is the revenue returned per dollar of server wages in each coffee shop?
2) Analysis of a Average Revenue Returned • You own two coffee shops. You are trying to understand the role that servers play in the creation of revenues • The shops sell 3 different size coffees and pastries and you have aggregated information on the weekly revenues and the total amount spent on servers each week. • Coffee shop #1 spends $1,333 on server wages and generates $10,000 in revenues • Coffee shop #2 spends $2,000 on server wages and generates $14,000 in revenues • What is the average rate of revenue being returned by the two stores?
3) Calculate the Meta-Return Rate of Meta-Revenue Machine • You have observed two coffee shop performances. You are trying to understand the role that servers play in the creation of revenues • The shops sell 3 different size coffees and pastries and you have aggregated information on the weekly revenues and the total amount spent on servers each week. • Observation #1 café spends $1,333 on server wages and generates $10,000 in revenues • Observation #2 café spends $2,000 on server wages and generates $14,000 in revenues • What is the Meta-Revenue Return rate, m?
4) Forecasting with the single point meta-revenue server machine • The boss proposes a $200 change in the total expenditure on servers as a means to increase revenues. The calibrated meta-revenue server machine for a single point (∆R,∆S) is∆R = 515%(∆S) • What is the forecasted change in Revenue, ∆R, given a proposed increase in server expense, ∆S = $200? • Forecasted change in Revenue, ∆R = 5.15 ($200) • Forecasted change in Revenue, ∆R = $1,030
Forecasting Revenue works in concert • With an analysis of a breakeven revenue, BER • In future classes we will calculate the breakeven revenue needed to cover the proposed change in the cost of the server expenditure, ∆S • It is usually more convenient to forecast the revenue using the slope-intercept equation of the meta-revenue server machine
5) Calculate the y-intercept of the slope-intercept equation of meta-revenue server machine • You have observed two coffee shop performances. You are trying to understand the role that servers play in the creation of revenues • The shops sell 3 different size coffees and pastries and you have aggregated information on the weekly revenues and the total amount spent on servers each week. • Observation #2 café spends $2,000 on server wages and generates $14,000 in revenues • What is the y-intercept of the slope-intercept equation of the Meta-Revenue machine?
5) Calculate the y-intercept of the Meta-Revenue Server Machine • Calibrated meta-revenue server machine uses • 1) one of the observed performances and • 2) the calculated meta-conversion rate, m • ∆R = m x ∆S • (R – R2) = 515% x (S – S2) • R – $14,000 = 5.15 x (S – $2,000) • Set the proposed input value to S=0 and solve for R = y-intercept, a
5) Calculate the y-intercept of the Meta-Revenue Server Machine • Set the proposed input value to 0 and solve for R = y-intercept, a • a– $14,000 = 5.15 x (0 – $2,000) • a = $14,000 – $10,300 = $3,700 • The y-intercept is a = $3,700 • The slope-intercept equation of the meta-revenue server machine is • Revenue, R = $3,700 + 515%(Server expenditure, S)
6) Forecast the Sale Revenue from a proposed level of server expenditure • Market Research has calibrated the meta-revenue server machine as • Revenue, R = $3,700 + 515%(Server expenditure, S) • The boss is proposing an increase in server availability that will result in a total server expenditure of S = $2,200 • What is the forecasted Sales Revenue that will be produced by the meta-revenue with $2,200 in server expense as an input? • Forecasted Revenue, R = $3,700 + 5.15( $2,200) • Forecasted Revenue, R = $3,700 + $11,330 • Forecasted Revenue, R = $15,030
6) Forecast the Sale Revenue from a proposed level of server expenditure • Market Research has calibrated the meta-revenue server machine as • Revenue, R = $3,700 + 515%(Server expenditure, S) • The boss is proposing an increase in server availability that will result in a total server expenditure of S = $2,200 • What is the forecasted Sales Revenue that will be produced by the meta-revenue with $2,200 in server expense as an input? • Forecasted Revenue, R = $3,700 + 5.15( $2,200) • Forecasted Revenue, R = $3,700 + $11,330 • Forecasted Revenue, R = $15,030 Always remember to convert the percent return back into a decimal before doing any calculations
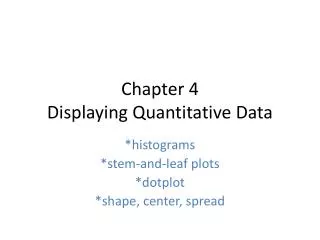
Revenue = kπa R = a + m(S)R =$3,700 +515%(S) R = Revenue x x R = kPπa x x x x x x x x x x x x x x x x x x Linear Revenue Meta-Machine is a secant that approximates the Revenue function S = server expenditure
7) Extend the meta-demand price equation or demand curve • Into a meta-revenue price equation • Market Research has estimated that the demand for a medium size coffee is explained by the size of the price tag as • Quantity sold, Q = 6,000 – 900(price tag, P) • What is the meta-revenue price machine equation? • Multiply both sides by the price tag, P • (P x Q) = 6,000P – 900(P)(P) • Revenue, R = 6,000P – 900P2
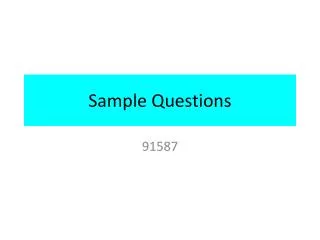
Estimated Meta-demand price machine or Demand curve Quantity Sold Demand Equation Q = 6,000 – 900(P) 2,400 Revenue = 2,400 x $4.00Revenue = $9,600 Price per Cup $3.90 $4.00 TJM
*) Forecast a revenue from the meta-revenue price machine using the expanded demand equation • Market research has estimated that the meta-revenue price equation that best explains revenues from sales of medium size cups at different prices is • Revenue, R = 6,000P – 900cp$ x P2 • Management wants to set the selling price at $4.10 a cup. What is the forecasted revenue at that price? • Revenue , R = 6,000($4.10) – 900cp$ x ($4.10)2 • Revenue , R = $24,600 – (900cp$ x 16.81$2) • Revenue, R = $24,600 – $15,129 = $6,471
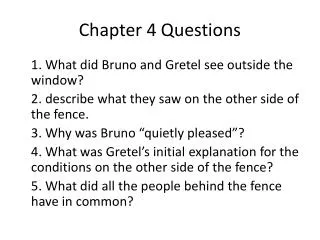
R= P(a-bP)R = aP - bP2 R= a-mP Revenue Price per cup 0 TJM
An Optimal Price, Pr* • In Future chapters we will learn that the optimal selling price, Pr* for maximum revenue for this demand curve is • dR/dP = 6,000 – 2(900 cp$)P set = 0 • Pr* = a/2(b) = (6,000 cups) /2(900 cp$) • Pr* = $3.33 per cup