Download
1 / 1
10 likes | 91 Views
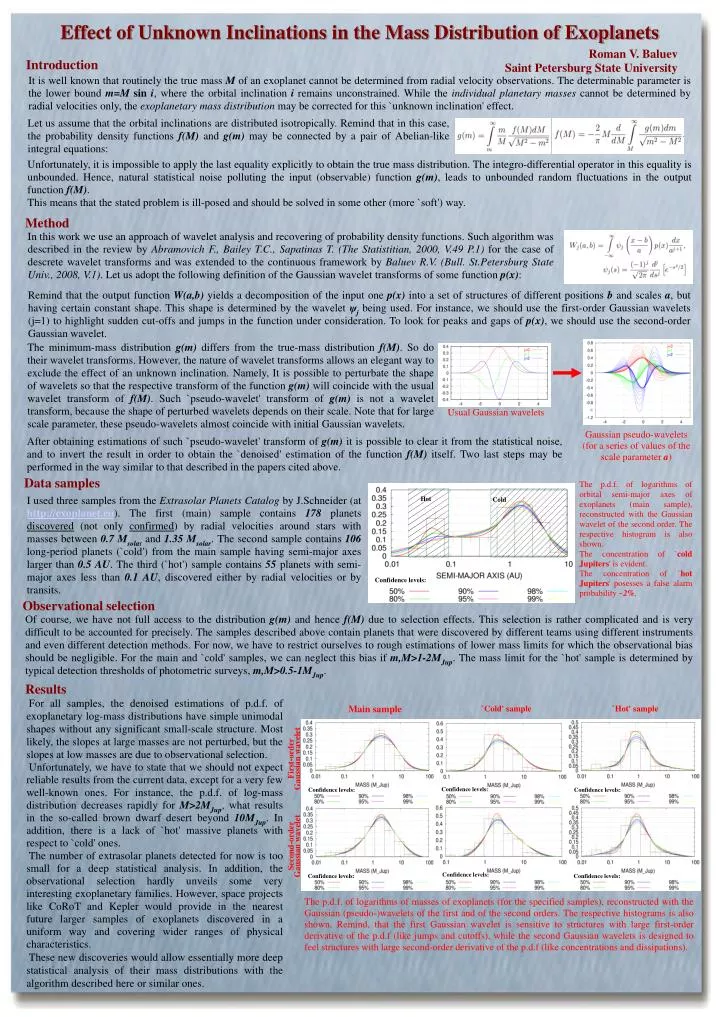
Usual Gaussian wavelets. Gaussian pseudo-wavelets (for a series of values of the scale parameter a ) . The p.d.f. of logarithms of orbital semi-major axes of exoplanets (main sample), reconstructed with the Gaussian wavelet of the second order. The respective histogram is also shown.

E N D
Usual Gaussian wavelets Gaussian pseudo-wavelets (for a series of values of the scale parameter a) The p.d.f. of logarithms of orbital semi-major axes of exoplanets (main sample), reconstructed with the Gaussian wavelet of the second order. The respective histogram is also shown. The concentration of `cold Jupiters' is evident. The concentration of `hot Jupiters' posesses a false alarm probability ~2%. Hot Cold Confidence levels: Main sample `Cold' sample `Hot' sample First-order Gaussian wavelet Confidence levels: Confidence levels: Confidence levels: Second-order Gaussian wavelet Confidence levels: Confidence levels: Confidence levels: The p.d.f. of logarithms of masses of exoplanets (for the specified samples), reconstructed with the Gaussian (pseudo-)wavelets of the first and of the second orders. The respective histograms is also shown. Remind, that the first Gaussian wavelet is sensitive to structures with large first-order derivative of the p.d.f (like jumps and cutoffs), while the second Gaussian wavelets is designed to feel structures with large second-order derivative of the p.d.f (like concentrations and dissipations). Effect of Unknown Inclinations in the Mass Distribution of Exoplanets Roman V. Baluev Saint Petersburg State University Introduction It is well known that routinely the true mass M of an exoplanet cannot be determined from radial velocity observations. The determinable parameter is the lower bound m=M sin i, where the orbital inclination i remains unconstrained. While the individual planetary masses cannot be determined by radial velocities only, the exoplanetary mass distribution may be corrected for this `unknown inclination' effect. Let us assume that the orbital inclinations are distributed isotropically. Remind that in this case, the probability density functions f(M) and g(m) may be connected by a pair of Abelian-like integral equations: Unfortunately, it is impossible to apply the last equality explicitly to obtain the true mass distribution. The integro-differential operator in this equality is unbounded. Hence, natural statistical noise polluting the input (observable) function g(m), leads to unbounded random fluctuations in the output function f(M). This means that the stated problem is ill-posed and should be solved in some other (more `soft') way. Method In this work we use an approach of wavelet analysis and recovering of probability density functions. Such algorithm was described in the review by Abramovich F., Bailey T.C., Sapatinas T. (The Statistitian, 2000, V.49 P.1) for the case of descrete wavelet transforms and was extended to the continuous framework by Baluev R.V. (Bull. St.Petersburg State Univ., 2008, V.1). Let us adopt the following definition of the Gaussian wavelet transforms of some function p(x): Remind that the output function W(a,b) yields a decomposition of the input one p(x) into a set of structures of different positions b and scales a, but having certain constant shape. This shape is determined by the wavelet ψj being used. For instance, we should use the first-order Gaussian wavelets (j=1) to highlight sudden cut-offs and jumps in the function under consideration. To look for peaks and gaps of p(x), we should use the second-order Gaussian wavelet. The minimum-mass distribution g(m) differs from the true-mass distribution f(M).So do their wavelet transforms. However, the nature of wavelet transforms allows an elegant way to exclude the effect of an unknown inclination. Namely, It is possible to perturbate the shape of wavelets so that the respective transform of the function g(m) will coincide with the usual wavelet transform of f(M). Such `pseudo-wavelet' transform of g(m) is not a wavelet transform, because the shape of perturbed wavelets depends on their scale. Note that for large scale parameter, these pseudo-wavelets almost coincide with initial Gaussian wavelets. After obtaining estimations of such `pseudo-wavelet' transform of g(m) it is possible to clear it from the statistical noise, and to invert the result in order to obtain the `denoised' estimation of the function f(M) itself. Two last steps may be performed in the way similar to that described in the papers cited above. Data samples I used three samples from the Extrasolar Planets Catalog by J.Schneider (at http://exoplanet.eu). The first (main) sample contains 178 planets discovered (not only confirmed) by radial velocities around stars with masses between 0.7 Msolar and 1.35 Msolar. The second sample contains 106 long-period planets (`cold') from the main sample having semi-major axes larger than 0.5 AU. The third (`hot') sample contains 55 planets with semi-major axes less than 0.1 AU, discovered either by radial velocities or by transits. Observational selection Of course, we have not full access to the distribution g(m) and hence f(M) due to selection effects. This selection is rather complicated and is very difficult to be accounted for precisely. The samples described above contain planets that were discovered by different teams using different instruments and even different detection methods. For now, we have to restrict ourselves to rough estimations of lower mass limits for which the observational bias should be negligible. For the main and `cold' samples, we can neglect this bias if m,M>1-2MJup. The mass limit for the `hot' sample is determined by typical detection thresholds of photometric surveys, m,M>0.5-1MJup. Results For all samples, the denoised estimations of p.d.f. of exoplanetary log-mass distributions have simple unimodal shapes without any significant small-scale structure. Most likely, the slopes at large masses are not perturbed, but the slopes at low masses are due to observational selection. Unfortunately, we have to state that we should not expect reliable results from the current data, except for a very few well-known ones. For instance, the p.d.f. of log-mass distribution decreases rapidly for M>2MJup, what results in the so-called brown dwarf desert beyond 10MJup. In addition, there is a lack of `hot' massive planets with respect to `cold' ones. The number of extrasolar planets detected for now is too small for a deep statistical analysis. In addition, the observational selection hardly unveils some very interesting exoplanetary families. However, space projects like CoRoT and Kepler would provide in the nearest future larger samples of exoplanets discovered in a uniform way and covering wider ranges of physical characteristics. These new discoveries would allow essentially more deep statistical analysis of their mass distributions with the algorithm described here or similar ones.